


 1
1
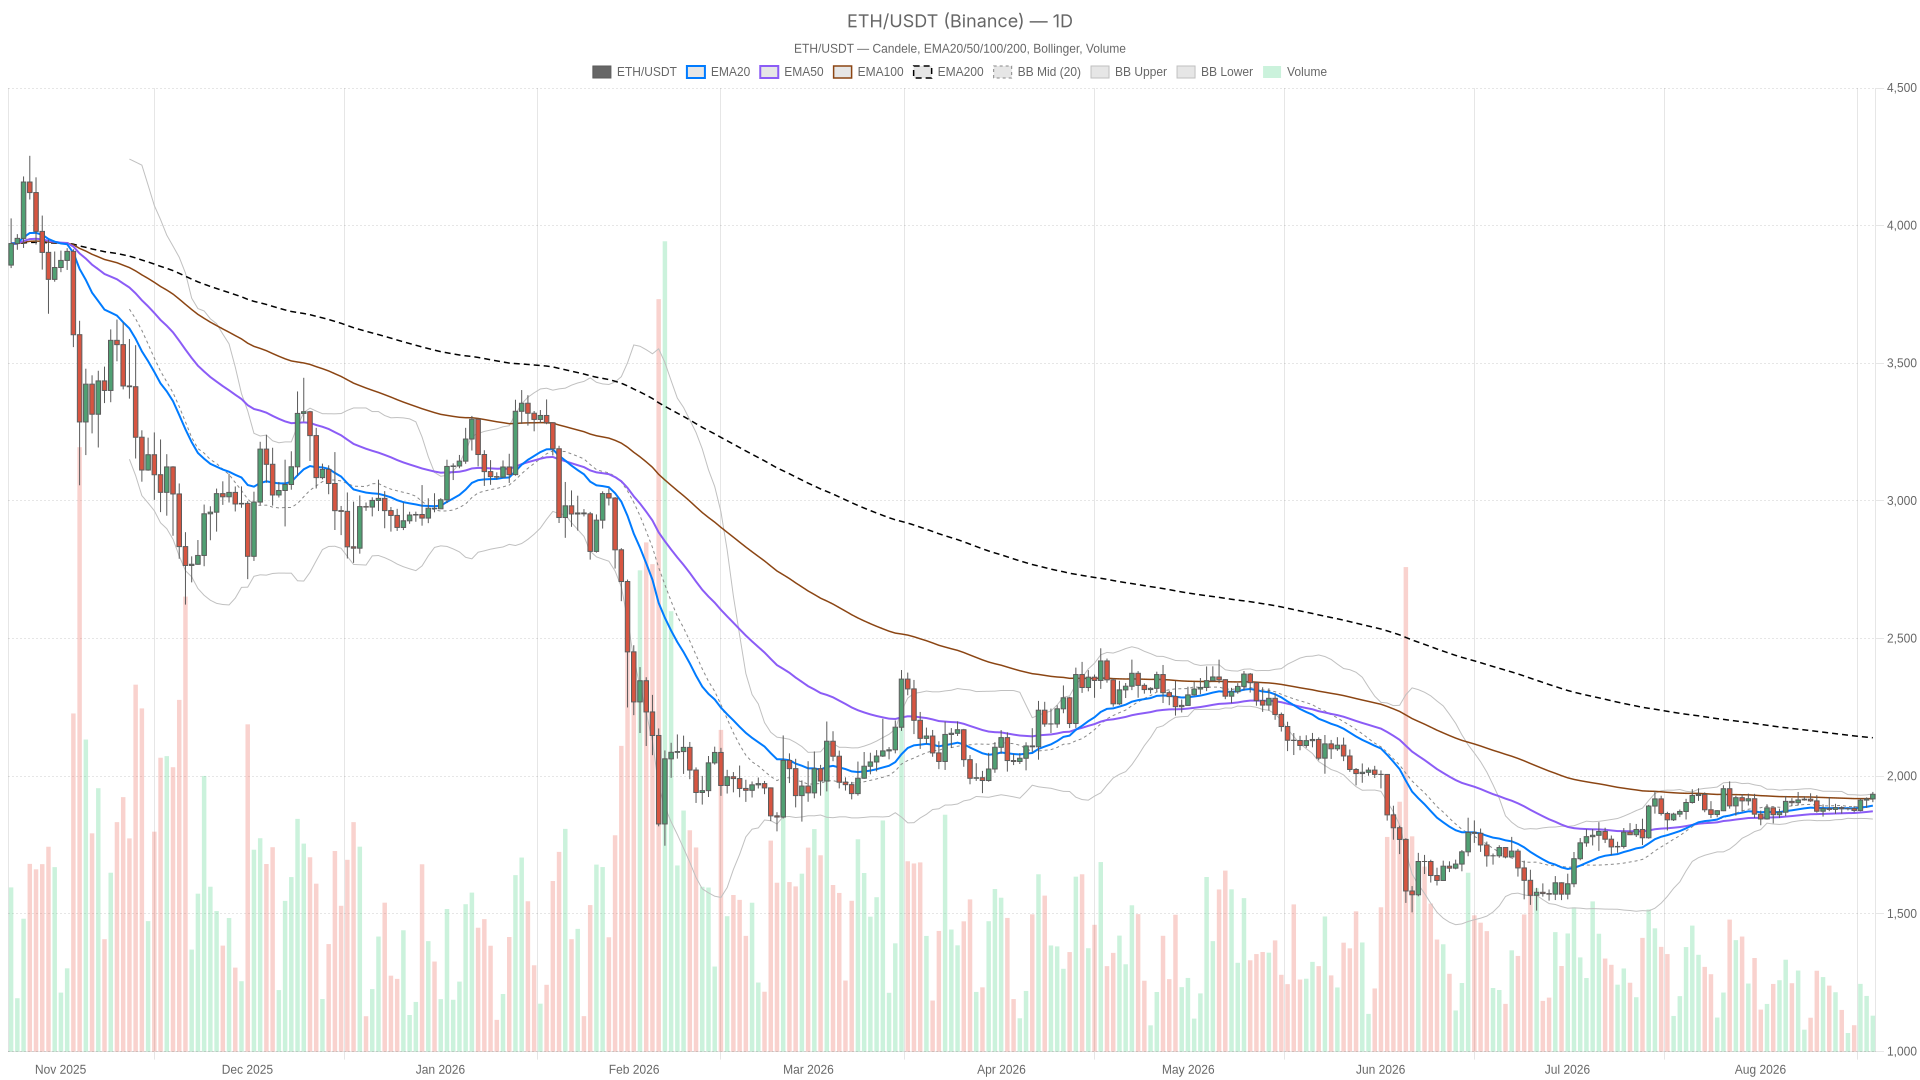
As of August 19, 2026, $ETH/$USDT sits at 1934.45, hovering above its daily EMAs while broader sentiment remains cautious. The Ethereum crypto market finds itself at a crossroads where short-term momentum conflicts with longer-term hesitation, creating a tense backdrop for traders.
Key takeaways
- $ETH trades at 1934.45, above EMA20 (1893.48) and EMA50 (1872.94) but below EMA200 (2140.04).
- Daily RSI at 60.14 signals bullish conditions without approaching overbought exhaustion.
- The Fear & Greed Index reads 46, reflecting caution despite a 0.97% rise in total crypto market cap.
- 1H and 15m charts show overbought readings, hinting at possible short-term consolidation or a volatility expansion.
Daily Timeframe: A Neutral Regime With a Bullish Lean
The system tags the daily regime as neutral, and the indicators reinforce that assessment rather than contradict it. RSI14 on the daily sits at 60.14 — firmly on the bullish side of neutral but nowhere near overbought exhaustion. That leaves room for continuation without immediately signaling a stretched market.
The MACD line (13.14) remains above its signal (12.35), producing a modest positive histogram of 0.79. However, it is a bullish cross that is shallow — momentum is building rather than accelerating. Bollinger Bands show the mid-band at 1890.31, with price pressing close to the upper band at 1936.
Moreover, that detail matters: price is testing the ceiling of its own recent volatility range. With an ATR14 of 35.7, daily swings have been fairly wide. A push through 1936 would not be a small move — it would require real conviction behind it. The daily pivot structure reinforces this: price is above the pivot point at 1927.89 and eyeing R1 at 1949.77, with S1 down at 1912.56 as the first line of defense.
1-Hour Chart: Bulls Are Clearly in Control
Zooming into the 1H, the picture sharpens considerably. The regime here is explicitly bullish, and the EMA stack confirms it cleanly: EMA20 (1918.42) above EMA50 (1910.1) above EMA200 (1898.08). That is a textbook uptrend alignment. RSI14 at 67.84 is pushing toward overbought, and the MACD histogram of 1.84 shows momentum that is still expanding rather than fading.
What stands out is the Bollinger Band read: price at 1934.45 is actually trading above the upper band at 1931.82. That is not a comfortable place to be — it usually means the move has run hot and is due either for a pause or a volatility expansion in the trend’s direction. The 1H pivot levels are extremely tight — pivot at 1935.36, R1 at 1936.77, S1 at 1933.03 — which tells you the market is coiled right at a decision point.
15-Minute Execution Context
Similarly, on the 15-minute chart the story repeats with even more urgency. RSI14 at 69.17 is knocking on the door of overbought, MACD histogram at 1.39 still shows buyers in charge, and price at 1934.6 sits essentially at the upper Bollinger Band (1934.03). ATR14 has compressed to 3.68, well below the 1H and daily readings. Any sharp move here could resolve quickly. The 15m pivot sits at 1935.41 — almost identical to the current close — indicating a market working through a decision zone in real time.
Multi-Timeframe Tension: Momentum vs. Structure
However, here is where the analysis must be honest about conflict. The 1H and 15m charts are unambiguously bullish — trending EMAs, rising MACD histograms, RSI pushing into stretched territory, and price trading at or above the upper Bollinger Band on both timeframes. That is classic short-term momentum behavior.
The daily chart, however, sets the macro bias, and it is labeled neutral for a reason: price remains more than 200 points below the EMA200 at 2140.04. That is not a minor technical footnote. It means the dominant multi-week structure is still recovering from a larger drawdown, and the current rally has not yet proven it can reclaim the longer-term trend.
As a result, when the 1H and 15m are overbought while the daily remains neutral under a distant EMA200, the more likely near-term outcome is consolidation or a pullback that resets shorter-term momentum rather than an immediate breakout to new highs.
On-Chain Flows: Rotation, Not Retreat
Meanwhile, away from price, Ethereum’s DeFi ecosystem is showing some interesting internal rotation. Uniswap V3 fees dropped 15.46% in the last 24 hours and 21.78% over seven days, which on its own might read as fading activity. Yet Uniswap V4 fees are up 7.52% daily and a striking 90.42% over 30 days.
Fluid DEX is up 56.68% daily and 40.47% over the month, while Curve DEX fees have climbed 65.56% over 30 days despite a rough single day. Ekubo has also seen 30-day growth of 35.09%. Taken together, this does not look like DeFi activity leaving the Ethereum crypto ecosystem — it looks like liquidity and volume migrating between protocols, with newer venues capturing flow that once concentrated on Uniswap V3.
Mainstream financial media is also watching this level closely. Fortune ran a piece dated August 18 specifically tracking Ethereum’s price, a reminder that moves like this one do not go unnoticed outside the trading community.
Bullish Scenario
For now, if $ETH can clear the daily Bollinger upper band near 1936 and push through the R1 pivot at 1949.77 with the 1H and 15m trends holding intact, that opens the door toward a more serious attempt to close the gap with the daily EMA200 at 2140.04. The ingredients are partly there — MACD is positive across all three timeframes, and the daily RSI at 60.14 has plenty of room before overbought.
However, what would invalidate this: a daily close back below the EMA20 at 1893.48, or a loss of the S1 pivot at 1912.56, would suggest the breakout attempt failed and momentum is rolling over rather than extending.
Bearish Scenario
Moreover, given how stretched the 1H and 15m readings already are — RSI near 68-69, price trading above the upper Bollinger Band on both — a pullback toward the daily pivot at 1927.89 or even back to the daily EMA20 at 1893.48 is a realistic near-term risk. Broader sentiment still reads Fear at 46, which adds to the caution.
This would be a classic case of short-term exhaustion meeting a macro structure that has not fully confirmed the move. However, the bearish case would be invalidated if any pullback holds above the S1 level at 1912.56 and momentum resets without breaking the EMA20 — buyers would still be in control of the broader structure.
Where This Leaves Traders
Ultimately, this is a market where timeframes are telling slightly different stories. The lower timeframes are bullish and stretched at the same time — a combination that often precedes either a strong breakout or a sharp reset, and right now it is genuinely unclear which comes first. The daily chart’s neutral regime, combined with price still sitting far under the EMA200, argues for patience rather than chasing the current move.
Moreover, volatility here is not trivial. The daily ATR of 35.7 and the tight pivot clustering on the 1H and 15m charts suggest moves can happen quickly once a level gives way. Add in a Fear & Greed reading of 46 against a backdrop of rising total market cap, and you have a market that is technically constructive but psychologically cautious. That gap between price behavior and sentiment is exactly the kind of environment where discipline around invalidation levels matters more than conviction about direction.
FAQ
What is the current $ETH price and key support level?
$ETH/$USDT is trading at 1934.45 as of August 19, 2026. The nearest support sits at the daily pivot of 1927.89, with stronger support at the EMA20 (1893.48) and S1 pivot at 1912.56.
Is Ethereum in a bullish or bearish trend right now?
The daily timeframe is neutral with a bullish lean — RSI at 60.14 and MACD are positive, but price remains well below the EMA200 at 2140.04. Lower timeframes (1H, 15m) are unambiguously bullish, though stretched.
Why does the Fear & Greed Index still show fear?
The Fear & Greed Index reads 46 despite a rising total crypto market cap of roughly $2.3 trillion. This suggests the broader crowd remains defensive even as price action on lower timeframes turns constructive.
What do the DeFi protocol fee shifts mean for Ethereum?
Declining fees on Uniswap V3 are being offset by strong growth on Uniswap V4, Fluid DEX, and Curve, indicating liquidity rotation between protocols rather than a withdrawal of activity from the ecosystem.
Disclaimer: This article is for informational purposes only and does not constitute financial advice, an investment recommendation, or a solicitation to buy or sell any financial instrument or cryptocurrency. The analysis provided is not indicative of future results. Investing in crypto assets and financial markets carries a high risk of capital loss. Always do your own research (DYOR) and consult a qualified financial advisor before making any decision.
Article produced with the assistance of artificial intelligence and reviewed by the editorial team.

 coinedition.com
 invezz.com
 cryptoslate.com