


Moderna, Inc. stock shows a bullish daily structure, yet shorter-term charts flash caution. The gap between the broader trend and the intraday tape defines the core story for MRNA right now. It sets up a classic trend-versus-pullback debate.
Key takeaways
- MRNA closed at $62.96 on August 18, holding above all three key daily EMAs in a textbook bullish stack.
- Daily RSI14 at 55.04 and a positive MACD histogram of 0.92 confirm intact uptrend momentum with no overbought signal.
- Hourly momentum is cooling: RSI14 slipped to 46.62 and MACD turned negative, though the daily trend remains firmly intact.
- Moderna and Merck’s Phase 3 melanoma trial met both recurrence-free and distant metastasis-free survival endpoints.
- MRNA shares climbed 44.2% in the prior six months, with elevated volatility (ATR14 of 3.76) still a defining feature.
Daily Chart: EMA Stack Confirms Bullish Structure
The daily chart maintains a clear bullish posture for Moderna, Inc. stock. Price holds above all three key moving averages, and constructive momentum readings support further upside.
EMA Structure and Trend Confirmation
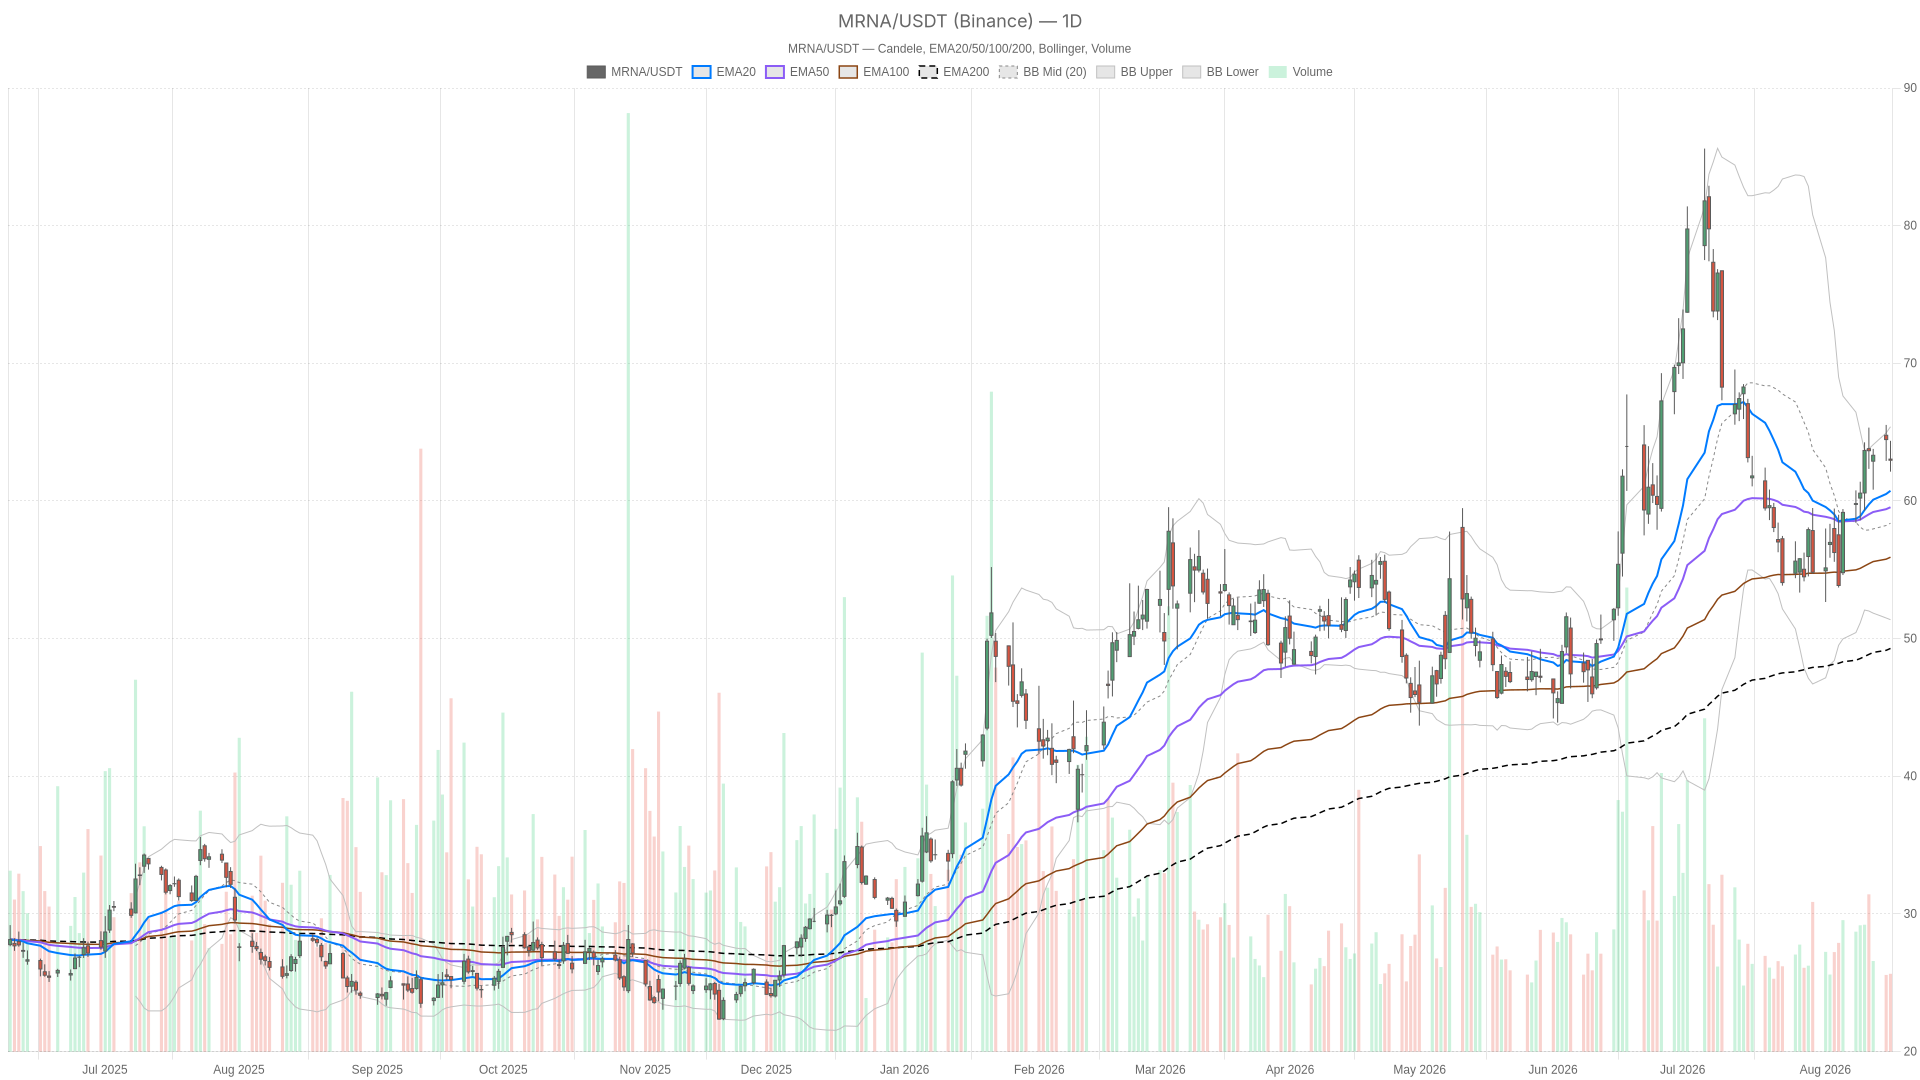
MRNA closed at $62.96 on August 18, slightly below the $63.04 open, after tagging a high of $64.37 and a low of $62.13. Volume came in at just over 4 million shares. The candle itself reads as a mild pause rather than a reversal.
The moving average structure remains clearly constructive. The 20-day EMA sits at $60.74, the 50-day EMA at $59.54, and the 200-day EMA far below at $49.29. That stacking is a textbook signature of an established uptrend. Price holds above all three EMAs, with the long-term average well beneath the shorter ones.
Momentum and Volatility Signals
The daily RSI14 reads 55.04, comfortably in neutral-to-bullish territory without any hint of overbought exhaustion. The MACD line at 0.59 sits above its signal line at -0.33, producing a positive histogram of 0.92. That is healthy bullish momentum, not a stretched reading. There is still room to run before this indicator flags fatigue.
The Bollinger Bands add context on volatility. The mid-band sits at $58.38, with the upper band at $65.39 and the lower band at $51.37. Price is trading in the upper half of that envelope—consistent with an uptrend not yet at extremes. Meanwhile, the ATR14 of 3.76 confirms daily ranges remain wide. This is a reminder that volatility in MRNA stays elevated compared to a quiet consolidation phase.
The daily pivot sits at $63.15, with resistance at $64.18 (R1) and support at $61.94 (S1). Overall, the system’s regime tag on this timeframe reads bullish, and the indicator mix agrees with that label.
1H Timeframe: Confirmation Fades as Momentum Cools
The hourly chart no longer confirms the daily bullish push. Short-term momentum has softened for Moderna, Inc. stock, with price slipping below near-term averages and the regime shifting to neutral.
Price closed at $62.95, down from a $63.77 open, after touching a high of $64.01 and a low of $62.75. Notably, the 20-hour EMA at $63.64 now sits above price, while the 50-hour EMA at $62.35 holds close behind. That is a subtle but real shift: short-term price action has slipped beneath its own near-term average.
Momentum on this timeframe is softening too. The hourly RSI14 has dropped to 46.62, just under the neutral 50 line. The MACD line at 0.25 has crossed below its signal at 0.51, producing a negative histogram of -0.26. In other words, the intraday momentum that carried MRNA higher over recent sessions is now losing steam. However, this does not automatically invalidate the daily bias. It simply suggests the market is digesting the recent advance rather than reversing outright.
The hourly Bollinger setup shows price trading closer to the lower half of its band. The mid-line sits at $63.87 and the lower band at $62.23. The pivot at $63.24, alongside resistance at $63.73 and support at $62.46, frames a fairly tight intraday range. The regime here is labeled neutral—the clearest signal that the 1H timeframe is not matching the daily bullish conviction. This is the conflict worth flagging: daily trend intact, hourly momentum stalling.
15-Minute View: Execution Context Only
The 15-minute chart offers short-term execution context rather than shaping the broader thesis for Moderna, Inc. stock. The tape leans mildly bearish, though this window is purely useful for timing entries.
Price closed at $62.95, below both the 20-period EMA at $63.57 and the 50-period EMA at $63.71. Still, it holds above the 200-period EMA at $62.10. The 15m RSI14 at 38.49 points to short-term selling pressure. At the same time, the MACD histogram is essentially flat at -0.01, reflecting indecision rather than strong directional conviction.
Price is also hugging the lower Bollinger band, with the mid-line at $63.49 and the lower band at $62.71. The nearby pivot at $63.09, support at $62.61, and resistance at $63.43 will likely define the next few hours of trading. Therefore, short-term traders should treat this zone as the immediate battleground rather than a signal of trend change.
News Flow Adds a Fresh Bullish Catalyst
The fundamental backdrop for Moderna, Inc. stock has turned notably positive. A major clinical milestone now reinforces the existing uptrend.
Moderna and Merck announced that their Phase 3 INTerpath-001 trial of intismeran autogene plus KEYTRUDA® met its endpoints. The trial achieved recurrence-free survival and distant metastasis-free survival in patients with completely resected Stage IIB-IV melanoma. Bloomberg reported that shares of both companies soared after the personalized cancer vaccine helped cut melanoma recurrence. The report called it an important milestone for the embattled mRNA-based technology.
Meanwhile, a Yahoo Finance piece noted that MRNA shares had already climbed 44.2% over the prior six months, hitting $63.36. That move came partly on the back of solid quarterly results. Together, these two developments—a strong pre-existing move plus a fresh clinical catalyst—explain why the daily trend has stayed intact. The intraday charts, in turn, are simply pausing for breath.
Bullish Scenario
The bullish case for Moderna, Inc. stock rests on the daily trend reasserting itself. A reclaim of the hourly EMA20 near $63.64, followed by a push through the daily pivot at $63.15, would be the first sign. Clearing R1 resistance at $64.18 would then confirm the pullback was shallow.
Given the strong EMA200 support far below at $49.29 and a still-positive daily MACD histogram, the structural backdrop favors continuation if buyers step back in. The melanoma trial news provides exactly the kind of fundamental tailwind that could fuel such a move. Follow-through volume will be the confirming signal to watch.
Bearish Scenario
The bearish risk centers on short-term weakness spreading rather than resolving. A break below the daily S1 support at $61.94, combined with the 15m chart losing its lower Bollinger band near $62.71, would suggest the pullback is deepening.
In that case, a retest of the daily EMA20 at $60.74 or even the EMA50 at $59.54 becomes plausible. What would invalidate the bullish thesis most clearly is a dual-timeframe breakdown. If the hourly regime shifts from neutral to outright bearish, with RSI14 sliding well below 40 across both the 1H and 15m timeframes, the daily uptrend would face its first real test.
Closing Take
Overall, Moderna, Inc. stock remains in a bullish daily posture, backed by a clean EMA stack, positive MACD momentum, and a fresh clinical catalyst from the Merck-partnered melanoma trial. In contrast, the hourly and 15-minute timeframes show that short-term momentum has cooled. Price has slipped under near-term averages, and RSI readings are drifting toward oversold on the lowest timeframe.
Elevated ATR readings on the daily chart confirm that volatility remains a feature, not a bug, of this name. Positioning around current levels should account for that two-speed dynamic. Traders will want to watch how price behaves around the daily pivot and S1/R1 levels before drawing firm conclusions about the next leg.
FAQ
What is the current trend for Moderna, Inc. stock?
The daily chart shows a clear bullish trend. MRNA trades above its 20-day EMA ($60.74), 50-day EMA ($59.54), and 200-day EMA ($49.29). The daily RSI14 at 55.04 and positive MACD histogram of 0.92 confirm constructive momentum without overbought signals.
Why is the hourly chart showing weakness?
The hourly chart reflects short-term digestion. The RSI14 has slipped to 46.62 and the MACD turned negative. However, this cooling does not invalidate the daily uptrend—it suggests the market is absorbing the recent advance rather than reversing.
What news is driving Moderna, Inc. stock?
Moderna and Merck announced positive Phase 3 INTerpath-001 trial results for their personalized cancer vaccine in melanoma. The trial met recurrence-free and distant metastasis-free survival endpoints. Additionally, MRNA shares had already gained 44.2% in the prior six months.
What are the key levels to watch for MRNA?
The daily pivot sits at $63.15, with resistance at $64.18 (R1) and support at $61.94 (S1). A reclaim of the hourly EMA20 near $63.64 would favor bulls. A break below S1 at $61.94 would suggest the pullback is deepening toward the daily EMA20 at $60.74.
Disclaimer: This article is for informational purposes only and does not constitute financial advice, an investment recommendation, or a solicitation to buy or sell any financial instrument or cryptocurrency. The analysis provided is not indicative of future results. Investing in crypto assets and financial markets carries a high risk of capital loss. Always do your own research (DYOR) and consult a qualified financial advisor before making any decision.
Article produced with the assistance of artificial intelligence and reviewed by the editorial team.

 invezz.com

 coinedition.com
 coinpedia.org
 coinpaper.com