



 5
5
The Ethereum price prediction is turning into an $ETH/$BTC story as much as a price story. The ratio just touched 0.0296, its best 30-day run in months, closing in on a level $ETH hasn’t held since last year, while spot $ETH ETFs quietly logged a fifth straight week of inflows. $ETH itself is stuck at $1,923.55, pressing the same descending trendline that’s rejected price twice this month, with $2,042 on the table if it finally breaks and $1,837 the fallback if it doesn’t.
$ETH Price Analysis: Pressing the Descending Trendline as SAR Flips the Key Test
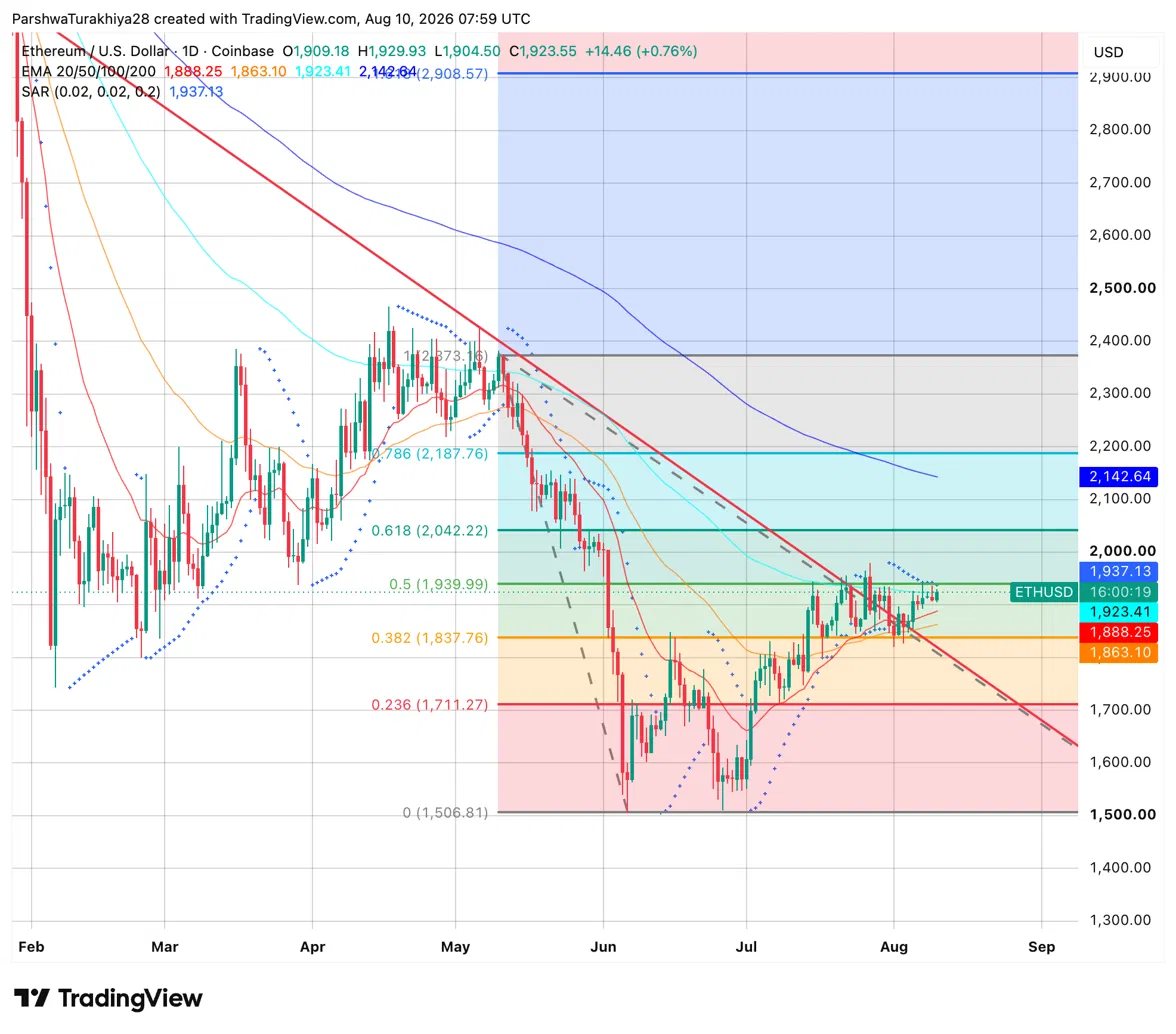
The daily chart shows $ETH sitting between the 0.382 Fibonacci at $1,837.76 and the 0.5 level at $1,939.99, with today’s session opening at $1,909.18, pushing to $1,929.93, and holding at $1,923.55. The descending trendline from the May peak near $2,373 continues to slope through the $1,920 to $1,940 area, making the current price action a direct test of that trendline for the third time in August.
Related: Cardano Price Prediction: Grayscale Drops Cardano ETF Plan as ADA Battles $0.20
The Parabolic SAR at $1,937.13 sits just above current price and remains bearish, meaning a daily close above $1,937 is needed to flip it bullish and confirm a trend change. The 20-day EMA at $1,888.25 and 50-day at $1,863.10 both sit below, providing support on any pullback. The 100-day EMA at $1,923.41 aligns almost exactly with current price, making this a critical daily close. The 0.618 Fibonacci at $2,042.22 and the $2,000 round number are the next targets if the trendline clears, with the 200-day at $2,142.64 as the broader recovery ceiling.
$ETH is holding strongly above the $1,900 level.
— Ted (@TedPillows) August 10, 2026
$2,000 should be next for Ethereum. pic.twitter.com/3HIFgrNWT9
Analyst Ted noted on X that $ETH is holding strongly above $1,900 and that $2,000 should be the next level, consistent with the technical setup.
$ETH Support and Resistance Levels, August 10, 2026
| Type | Price | Level |
| Resistance | $1,937.13 | Parabolic SAR, must flip for trend change |
| Resistance | $1,939.99 | 0.5 Fibonacci and descending trendline |
| Resistance | $2,000 | Round number and psychological level |
| Resistance | $2,042.22 | 0.618 Fibonacci |
| Resistance | $2,142.64 | 200-day EMA, longer term ceiling |
| Support | $1,923.41 | 100-day EMA, current price level |
| Support | $1,888.25 | 20-day EMA |
| Support | $1,837.76 | 0.382 Fibonacci, key floor |
$ETH Derivatives: Volume More Than Doubles as Shorts Take the Pain
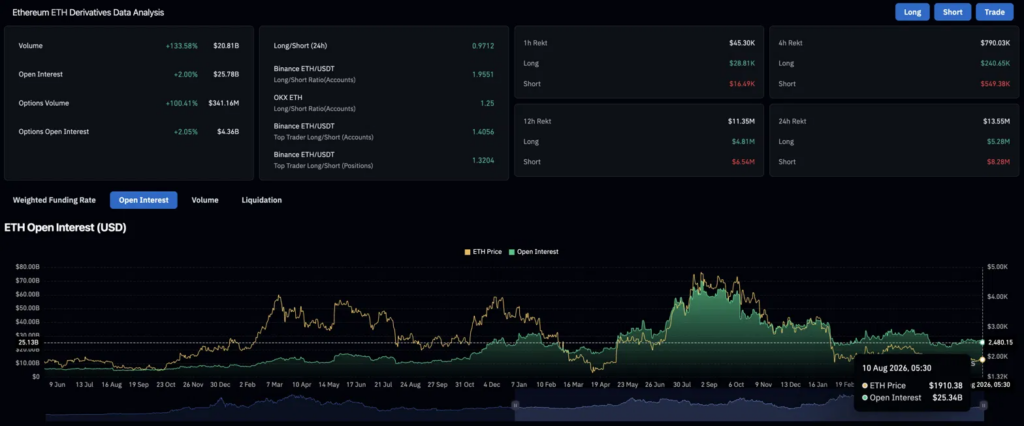
Volume surged 133.58% to $20.81B while open interest rose 2% to $25.78B, pointing to a sharp spike in trading activity rather than quiet accumulation. Options volume doubled too, up 100.41% to $341.16M, with options open interest rising 2.05% to $4.36B. Top trader position sizing at 1.3204 leans long, and liquidations over 24 hours totaled $13.55M with shorts absorbing $8.28M against $5.28M for longs, consistent with price pushing against the trendline and keeping downside bets under pressure.
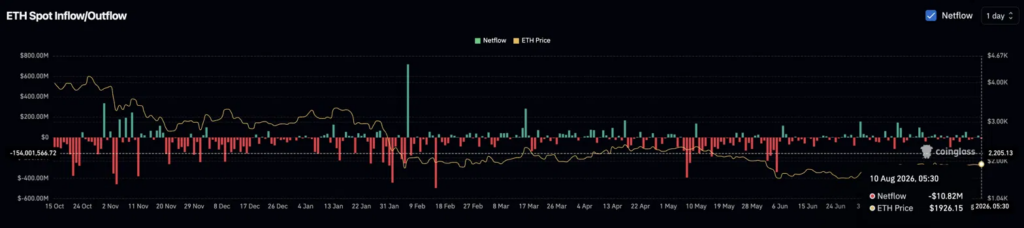
Meanwhile, Spot netflow registered -$10.82M on August 10, meaning more $ETH moved off exchanges than onto them. A sustained pattern of negative netflow alongside rising price is typically a bullish undercurrent, indicating holders are removing supply from the sellable float rather than preparing to sell.
| Metric | Value | Interpretation |
| 24h Volume | $20.81B (+133.58%) | Sharp spike in trading activity |
| Open Interest | $25.78B (+2%) | Fresh positioning being added |
| Options Volume | $341.16M (+100.41%) | Active hedging at the trendline level |
| Top Trader L/S (Positions) | 1.3204 | Large accounts net long |
| 24h Liquidations | $13.55M | Shorts absorbed the majority |
| Spot Netflow | -$10.82M | $ETH leaving exchanges, supply tightening |
Related: Bitcoin Price Prediction: Is the CLARITY Act Delay Giving Institutions Time to Load Up Before $73,000
Ethereum News: $ETH/$BTC Quietly Breaking Out
$ETH/$BTC IS QUIETLY BREAKING OUT.
— Master of Crypto (@MasterCryptoHq) August 10, 2026
$ETH/$BTC is at 0.0296 after its best 30-day run in months.
A clean move above 0.03 could break a level $ETH hasn’t held since last year.
If 0.03 becomes support, $ETH could lead the market – and L2s, DeFi and other $ETH-related assets could follow. pic.twitter.com/kRJst5MPrn
Analyst Master of Crypto flagged on X that the $ETH/$BTC ratio has reached 0.0296 after its best 30-day run in months. A clean move above 0.03 would break a level $ETH has not held since last year, and if 0.03 becomes support rather than resistance, $ETH could begin leading the broader market rather than following Bitcoin. That scenario historically pulls L2 tokens, DeFi assets, and other $ETH-related assets higher alongside it.
Bitcoin Spot ETFs Saw $854M in Net Inflows Last Week; Ethereum ETFs Took In $245M
— Wu Blockchain (@WuBlockchain) August 10, 2026
From August 3 to 7 (ET), Bitcoin spot ETFs recorded $854 million in net inflows, while Ethereum spot ETFs saw $245 million, marking five consecutive weeks of inflows. Solana, $XRP and $HYPE spot ETFs… pic.twitter.com/64xtJ53EcS
The $ETH/$BTC breakout and the spot ETF inflow data are pointing in the same direction. Wu Blockchain reported that $ETH spot ETFs took in $245M during the week of August 3 to 7, marking five consecutive weeks of net inflows. Bitcoin ETFs brought in $854M over the same period, with $ETH’s $245M representing a meaningful share of the total altcoin ETF flow for the week. Solana, $XRP, and $HYPE ETFs logged $144.9K, $1.01M, and $2.84M respectively, making $ETH the clear leader among altcoin products.
Related: Pump.fun Price Prediction: Can PUMP Hold Its Breakout After Selling $807M in SOL?
$ETH Price Prediction: Upside and Downside Targets
Bullish Case, Target: $2,042 (0.618 Fibonacci)
$ETH closes above the Parabolic SAR at $1,937.13 and the descending trendline on a daily basis, flipping the SAR bullish for the first time since May. The $ETH/$BTC ratio clears 0.03 and begins attracting fresh capital into $ETH-related assets as it takes the market lead. Five consecutive weeks of ETF inflows extend to a sixth and price pushes through the $2,000 round number toward the 0.618 Fibonacci at $2,042.22.
Bearish Case, Risk Level: $1,837 (0.382 Fibonacci)
The descending trendline rejects price again and $ETH loses the 100-day EMA at $1,923.41 on a daily close. The $ETH/$BTC ratio fails to clear 0.03 and reverses, keeping Bitcoin in the lead and limiting altcoin upside. Spot netflow turns positive as holders return $ETH to exchanges and the 20-day EMA at $1,888.25 gives way, sending price toward the 0.382 Fibonacci at $1,837.76 as the next meaningful support.
Conclusion
$ETH’s next move looks like it depends on two things resolving at once rather than one clean signal. The chart needs a daily close above $1,937 to flip the SAR bullish, and the $ETH/$BTC ratio needs to clear 0.03 to shift $ETH from following Bitcoin to leading it.
Both are close enough to be live possibilities this week, and both are backed by real flow data, five weeks of ETF inflows and negative spot netflow, rather than just chart patterns. Hold the 100-day EMA at $1,923.41 and $2,042 stays in reach; lose it, and $1,837 becomes the next real test.
FAQs: Ethereum ($ETH) Price Prediction
$ETH trades at $1,923.55 and is testing a descending trendline. The bullish target is $2,042 (0.618 Fibonacci); the bearish risk level is $1,837 (0.382 Fibonacci) if the trendline rejects again.
At 0.0296, $ETH/$BTC is close to a level not held since last year. If it clears 0.03 and holds as support, $ETH could start leading the market instead of following Bitcoin, a shift that historically lifts L2 and DeFi tokens alongside it.
Spot $ETH ETFs took in $245M for the week of August 3 to 7, the fifth consecutive positive week and the largest share of altcoin ETF flow that week, well ahead of Solana, $XRP, and $HYPE combined. It points to sustained institutional demand rather than a one-off spike.
$ETH needs a daily close above the Parabolic SAR at $1,937.13 and the descending trendline near $1,940 to flip short-term momentum bullish. From there, $2,000 and the 0.618 Fibonacci at $2,042.22 become the next targets.
$ETH’s setup has real tailwinds, including ETF inflows and tightening exchange supply, but the trendline has already rejected price twice this month. Weigh the bullish and bearish cases above against your own risk tolerance.

 en.bitcoinsistemi.com

 coindesk.com

 cryptoslate.com

 u.today