



 13
13
Bitcoin is about to enter an important liquidity zone where price action and derivatives positioning indicate rising volatility. While downside liquidation pools have mostly been cleared during prior selloffs, the most recent 24-hour liquidation map indicates that liquidity is still highly concentrated above the current market price.
Asymmetric setup is formed
Over the upcoming sessions, traders will be closely monitoring this asymmetric setup. The largest immediate concentration of short liquidations is located just above the current price, starting around $65,000, according to the most recent Hyperliquid liquidation data. This level is the closest significant liquidity magnet, with cumulative short leverage of more than 1,500 $BTC concentrated around it.
After that, liquidation exposure keeps rising steadily until it reaches the $70,000–$75,000 range, where cumulative short positions start to grow considerably. In the past, markets have tended to favor locations with significant liquidation liquidity, especially when prices enter periods of low volatility.
Therefore, as forced short covering increases buying pressure on an already rising market, a move through $65,000 could happen swiftly. A different story can be found on the other side of the map. Following Bitcoin's protracted correction, the majority of long liquidation clusters below the current price have already been significantly diminished.
Long leverage pockets still exist below $60,000, but they are much smaller than the concentration of shorts above.
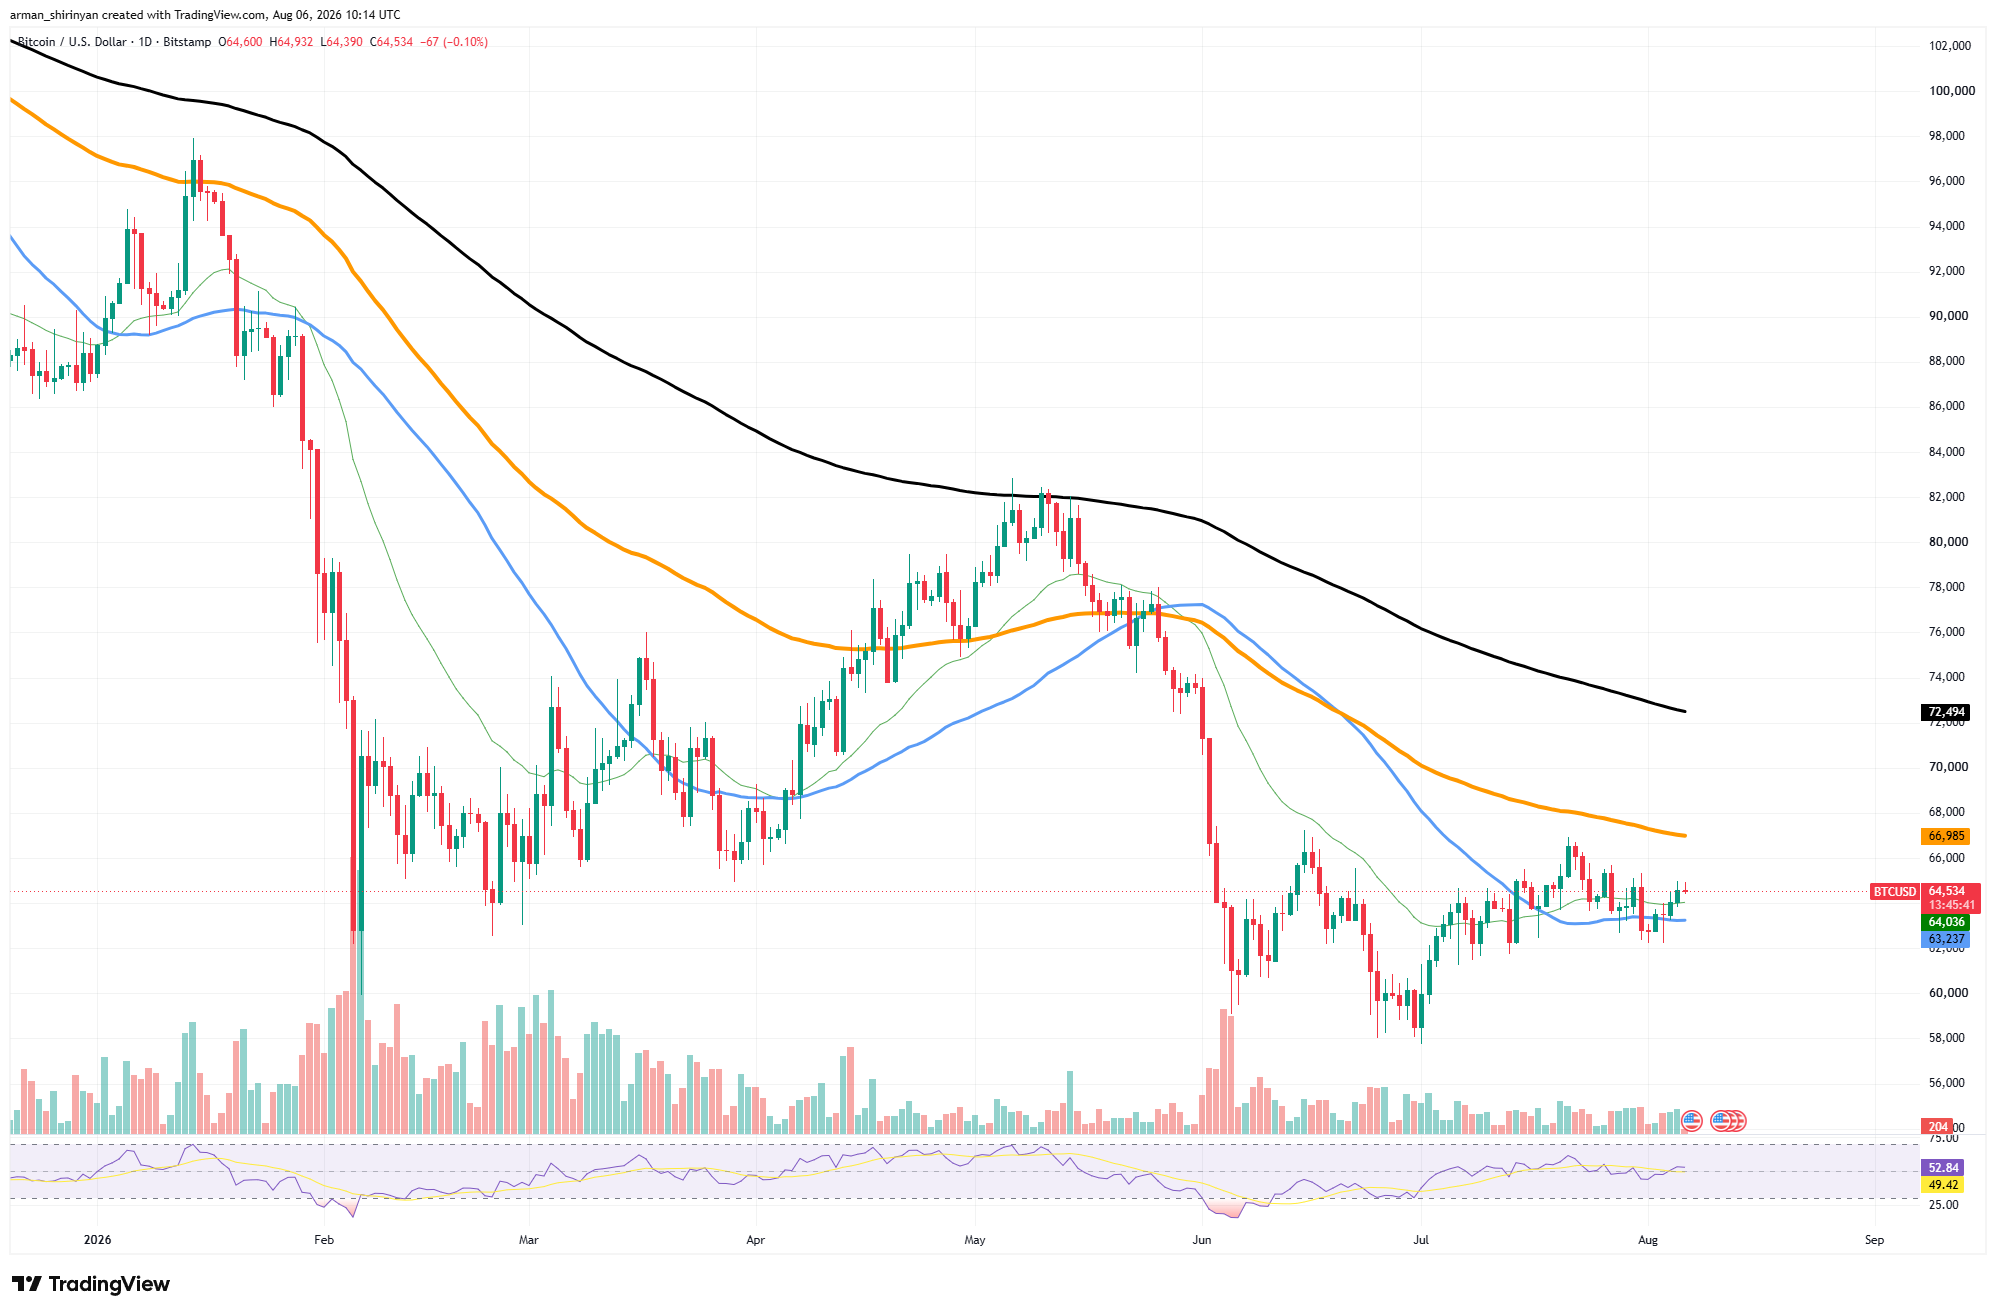
From the standpoint of derivatives, this makes it easier to move upward, but it does not ensure that the price will do so right away. A similarly balanced picture can be seen in the daily chart. Bitcoin is still trading between its 20-day and 50-day moving averages, with its price stabilizing at $64,500.
Moving averages are straightening
After a few weeks of sideways trading, the short-term moving averages have flattened, suggesting that bearish momentum has significantly diminished, even though the overall trend is still neutral. The declining 200-day moving average is still much higher at $72,500, while the next technical barrier is located around the 100-day moving average near $67,000.
The RSI has recovered to roughly 53, putting momentum in nearly neutral territory and providing room for a stronger directional move after the consolidation is over. As of right now, the liquidation map indicates that market makers and leveraged traders find upside liquidity to be a more alluring target.
But before that scenario can fully materialize, Bitcoin still needs to reclaim nearby resistance levels. Until then, the predominant short-term structure remains consolidation around current prices, with a break above $65,000 likely acting as the initial catalyst for a more significant move driven by liquidity.

 en.bitcoinsistemi.com

 coindesk.com