


 4
4
Bitcoin is back at a key support area after losing its recent breakout level, leaving traders split on the next move.
The Moon Show says $BTC needs a strong reaction from support, while SuperBro says a CME gap fill and possible moving average cross could still push Bitcoin toward $70,000.
Bitcoin Slips Below Breakout Level as Bulls Face Key Support Test
Bitcoin has lost a recently reclaimed resistance level, raising concerns that the latest breakout attempt may have failed, according to crypto analyst The Moon Show.
In a post on X, the analyst said $BTC was unable to hold above its breakout zone, a development that could shift short-term momentum in favor of sellers unless buyers step in at support.
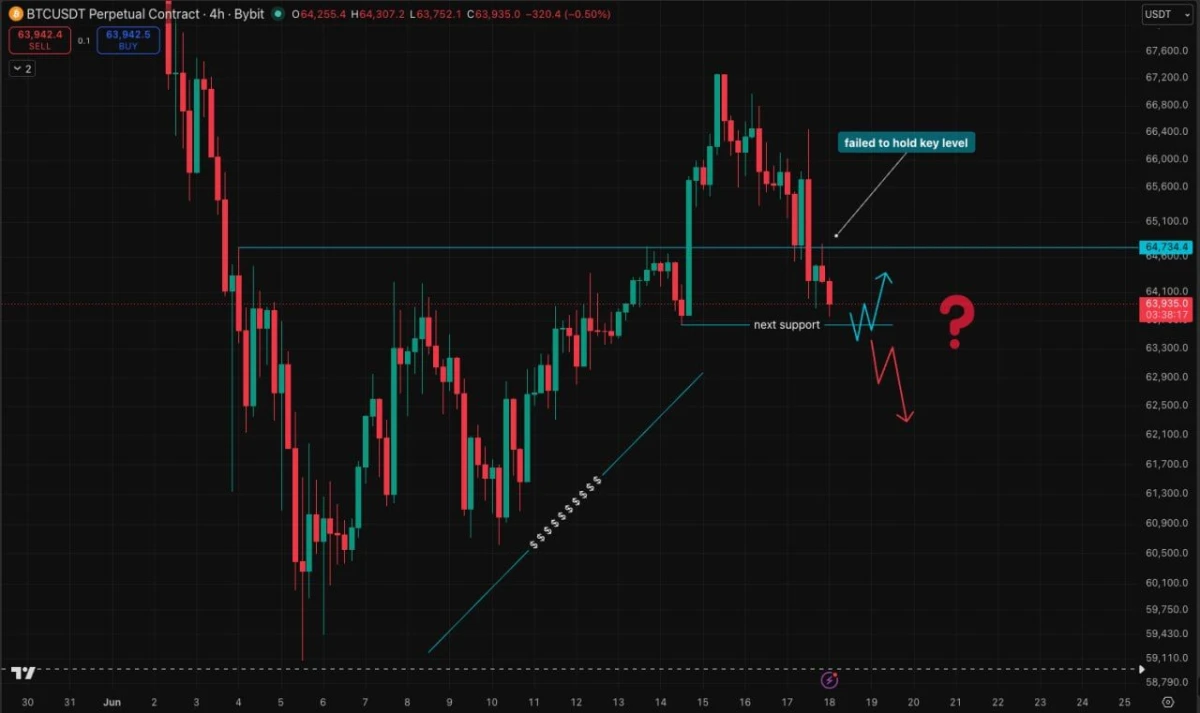
$BTC/$USDT 4-Hour Support Test. Source: The Moon Show (@TheMoonShow)
The four-hour $BTC/$USDT chart on Bybit shows Bitcoin falling back below a key level near $64,734 after briefly trading above it. The analyst labeled the move as a failure to hold the breakout, a signal often viewed as bearish in the short term.
According to the chart, the next area to watch sits near $63,500, which is marked as the nearest support zone. The Moon Show suggested that Bitcoin needs a strong reaction from this level to prevent a deeper pullback.
The chart outlines two possible scenarios. A bounce from support could allow $BTC to reclaim the lost breakout level and restore bullish momentum. However, a breakdown below support could open the door to a move toward the $62,000-$62,500 region.
For now, Bitcoin remains at a critical technical level, with the market waiting to see whether buyers can defend support and reverse the recent weakness.
Bitcoin Fills CME Gap as Bullish Moving Average Cross Nears, Analyst Says
Bitcoin is testing a key support area as traders watch for a potentially bullish moving average crossover on the four-hour chart, according to crypto analyst SuperBro.
In a post on X, the analyst said $BTC is filling a CME gap while approaching a possible 50-period and 100-period moving average bullish cross, a signal that could support further upside if current levels hold.
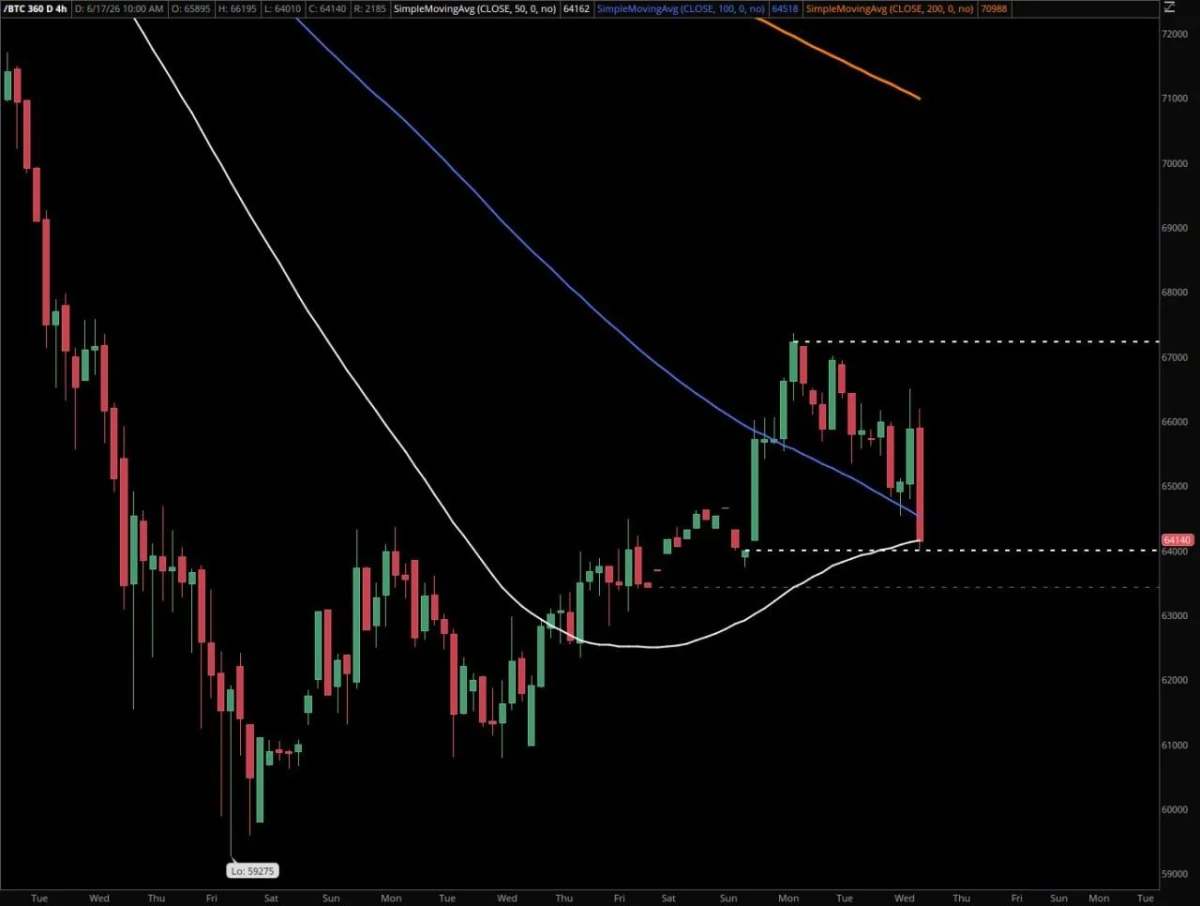
$BTC 4-Hour Moving Average Cross. Source: SuperBro (@SuperBitcoinBro)
The four-hour $BTC chart shows Bitcoin pulling back toward the area around $64,100, where the 50-period moving average and a key support zone are beginning to converge. The recent decline appears to be filling a previously unfilled CME futures gap, a price area traders often monitor because gaps have historically tended to be revisited.
According to SuperBro, bulls want to see Bitcoin stabilize near current levels so the anticipated crossover between the 50-period and 100-period moving averages can be completed. Such a crossover is generally viewed as a sign of improving short-term momentum.
The chart also highlights resistance near $67,200, while the 200-period moving average remains higher around the $71,000 area.
If support holds and the crossover confirms, the analyst believes Bitcoin could build momentum toward $70,000 before the end of the month. However, a failure to defend the current support zone could delay the bullish setup and increase the risk of additional downside pressure.
For now, traders are watching whether Bitcoin can hold the CME gap area and complete the moving average crossover that bulls hope will drive the next leg higher.


