

 5
5
The TRIX indicator, which has reliably flagged the lowest Bitcoin price for each cycle since 2015, has now identified where the asset could bottom for the current cycle.
Bitcoin ($BTC) plummeted to a floor price of $60,000 in early February, and market analysts have continued to assess whether this marked the bottom of its cycle. Amid the uncertainty, data from the reliable TRIX indicator shows that Bitcoin may bottom around the $30,000 mark this cycle.
Key Points
- Bitcoin’s lowest price for this cycle came at $60,000 during the early February 2026 crash.
- While some analysts believe this marked the cycle bottom, the TRIX indicator suggests prices could go lower.
- The indicator has reliably flagged the Bitcoin cycle bottom through a descending trendline on the 1-month chart since 2015.
- If the historical trend continues to play out, data indicates Bitcoin could bottom at around $30,000 this cycle.
What is The TRIX Indicator?
Bitcoin analyst CryptoCon recently highlighted this trend, calling it a simple observation for the Bitcoin bottom cycle. Notably, chart data shows that the TRIX indicator has persistently signaled Bitcoin’s bottom across multiple cycles in more than a decade.
For the uninitiated, the TRIX indicator (Triple Exponential Average) is a tool that analysts use to measure momentum. It is derived from a triple-smoothed exponential moving average of an asset’s price, which helps reduce market noise and highlight the underlying trend better.
The indicator oscillates above and below a central zero level. Specifically, when the line is above zero, it typically indicates upward momentum, while movements below zero confirm that the market is witnessing downward momentum. The Bitcoin TRIX sits at 298 on the monthly chart.
Bitcoin’s TRIX Indicator Trend
For CryptoCon’s analysis, the market watcher drew a descending trendline that has aligned with the TRIX indicator’s movements since 2015. Interestingly, data shows that each time the indicator has dropped to retest this trendline, it has marked Bitcoin’s bottom for the prevailing cycle.
This pattern first played out in early 2015, when Bitcoin dropped to the $166 bottom in January 2015, aligning with a downward retest of the trendline.
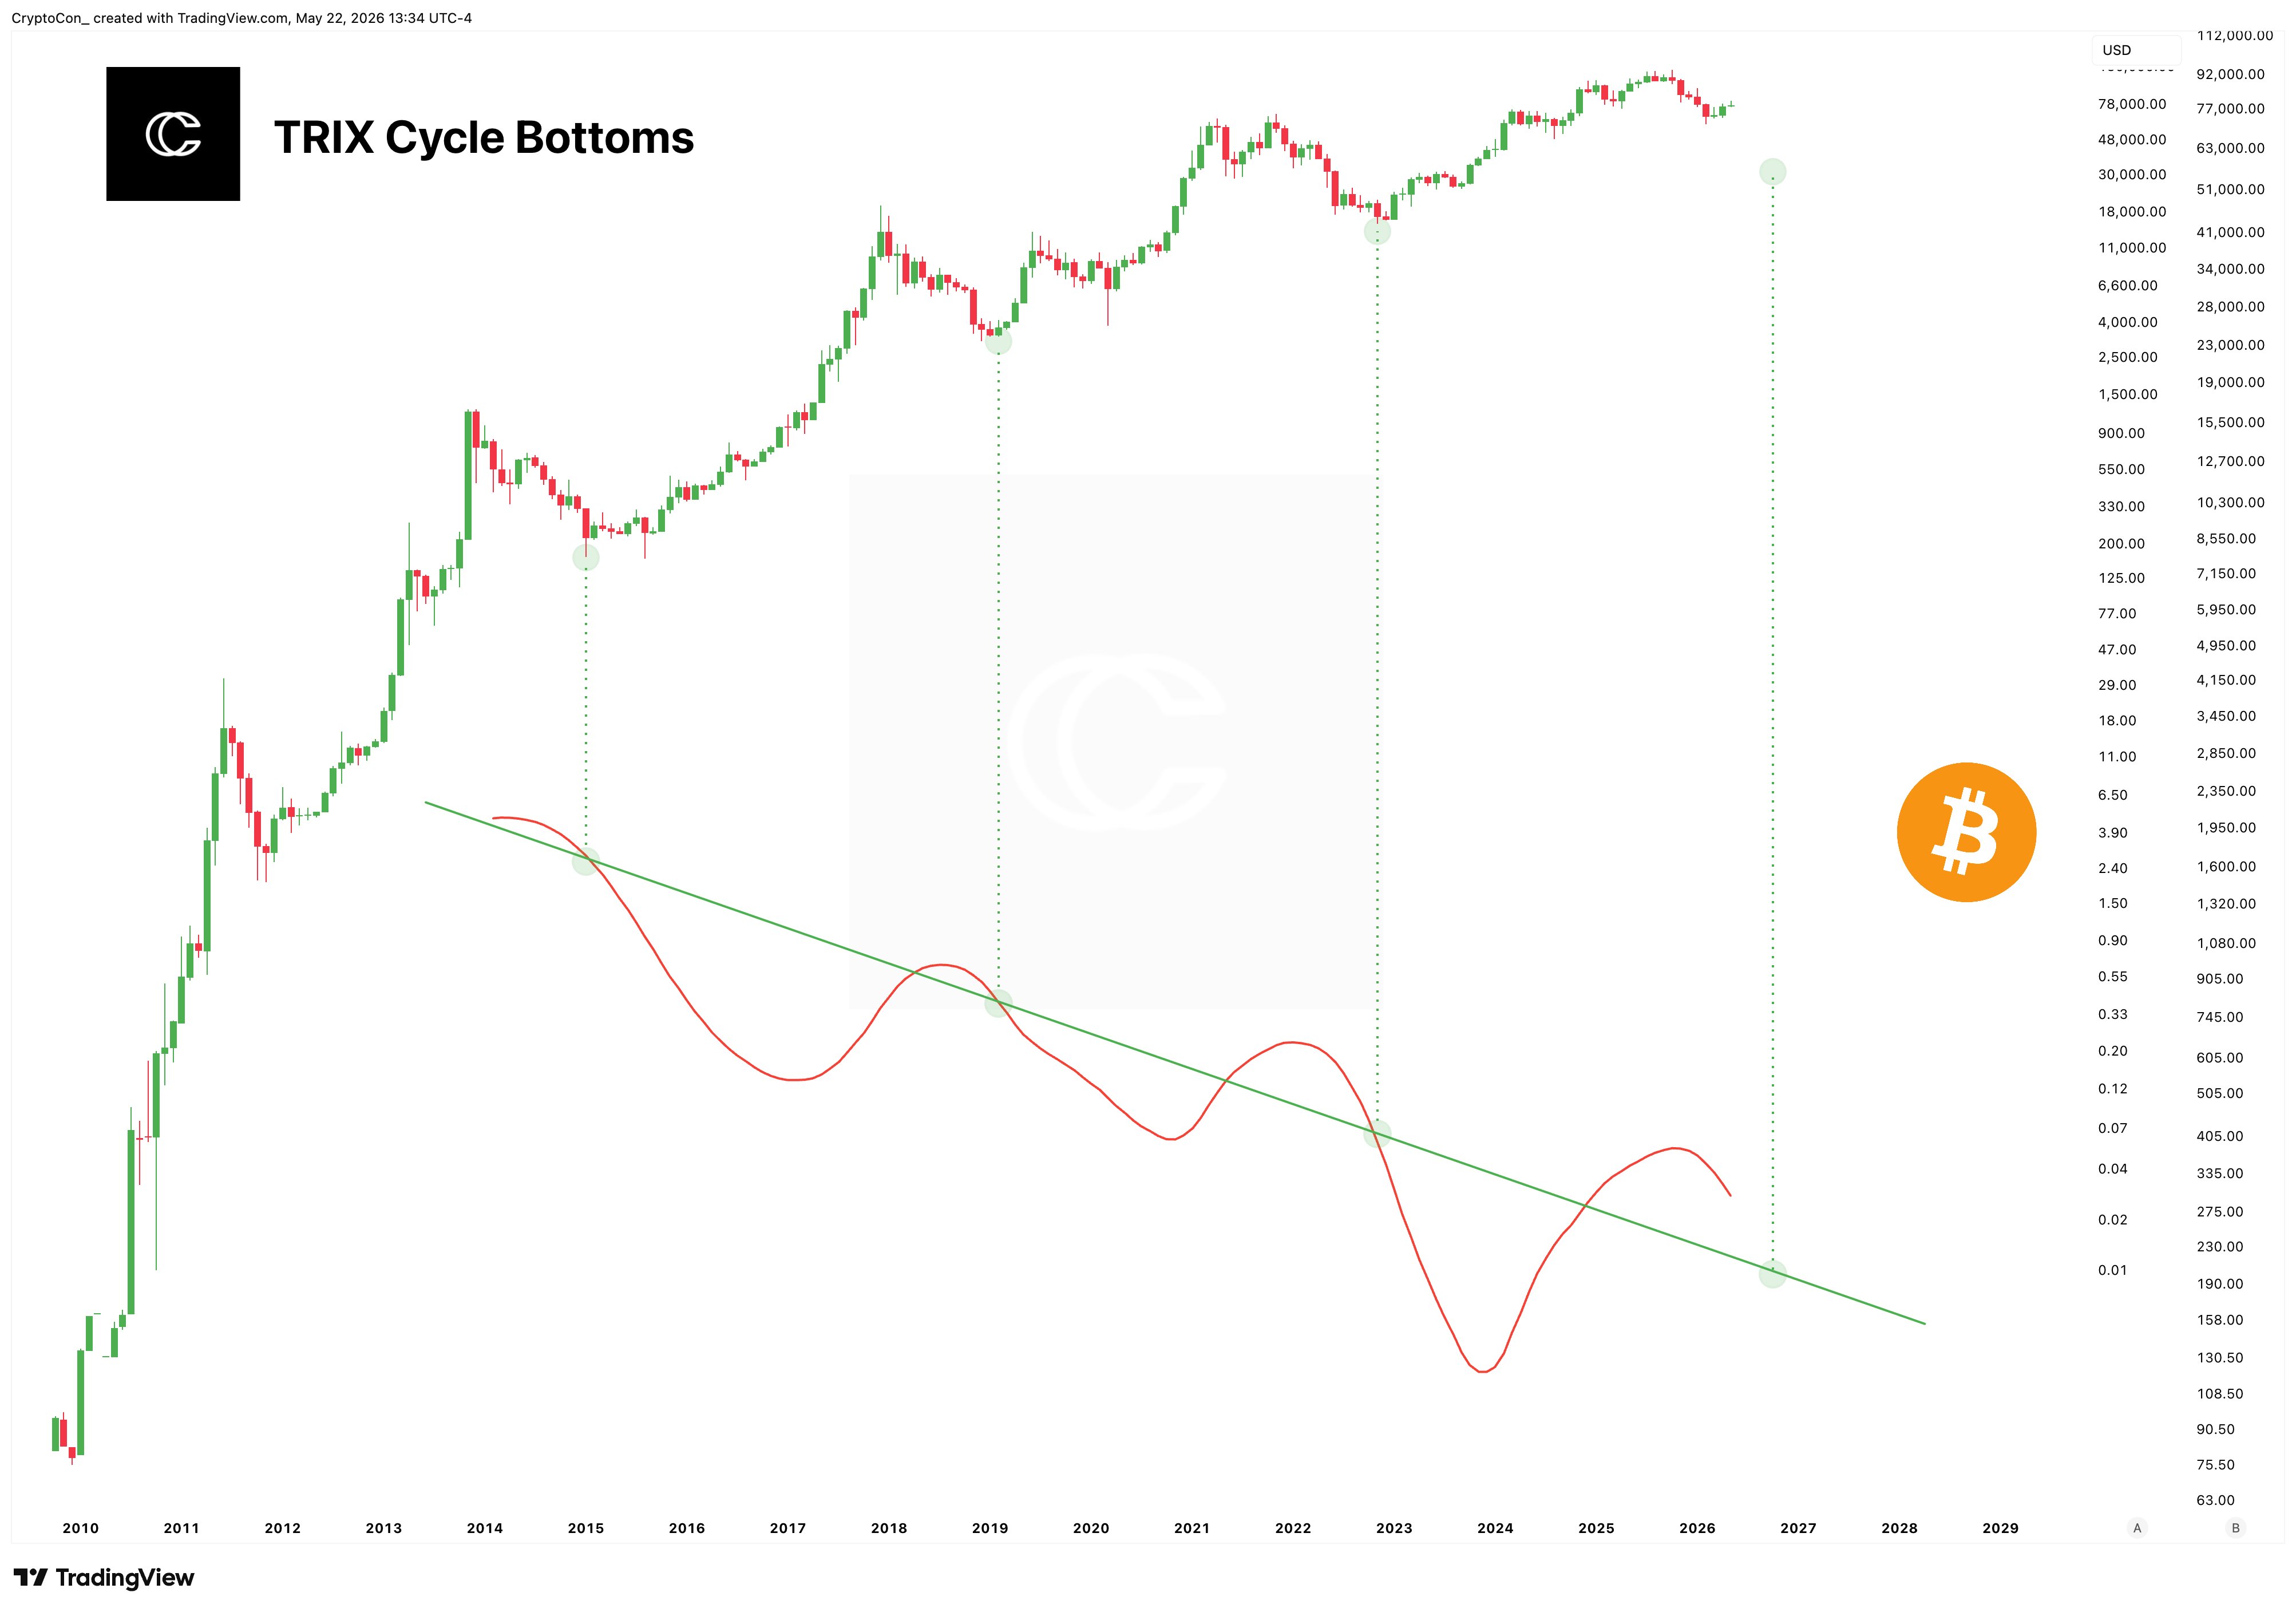
Meanwhile, in 2018, Bitcoin dropped to a bottom of $3,125 by December amid the bear market at the time. Again, this aligned with a downward retest of the descending trendline.
When the TRIX indicator crashed to test the trendline in November 2022, Bitcoin’s price had collapsed to $15,500 in the aftermath of the FTX implosion. This price marked Bitcoin’s bottom for the cycle.
Possible Bitcoin Bottom for This Cycle
Further data from the chart shows that the indicator has continued to trend downward since late 2025, but has still not retested the descending trendline despite Bitcoin’s massive downward price drop, down nearly 15% this year at the current price of $74,600.
With the TRIX line moving in sync with Bitcoin’s price action, the crypto asset would have to continue declining for the indicator to finally retest the trendline. CryptoCon’s chart shows that this retest would align with a Bitcoin price of around $30,000, which could possibly mark the bottom for this cycle.
From the current price of around $74,600, $BTC would have to drop by nearly 60% to reach the $30,000 mark. This would also represent a 76% drawdown from the late 2025 all-time high of $126,000, aligning with similar drawdowns from past cycles.


