

 4
4
Bitcoin consolidation around $74,000–$75,000 is the only story that matters right now. Analysts have identified this zone as a critical structural support level that must hold to preserve the longer-term bullish outlook.
A daily close below $74,000 would weaken the prevailing framework and increase the probability of a deeper retracement toward $72,000.
Bitcoin has tested this floor before. How it closes the current week will set the tone for June.
Why This Level Is Different From Prior Pullbacks
Near-term pressure comes from hot inflation data, U.S.-Iran tensions, ETF outflows, and leveraged long liquidations stacking simultaneously.
That combination has pushed Bitcoin from $82,000 in early May to $74,572 today — a 9% drawdown in three weeks.
The $74,000 level represents the 2025 yearly lows last tested in April — a zone where institutional long-term holders have historically stepped in to accumulate before the next expansion phase.
Standard Chartered’s Geoffrey Kendrick noted that Bitcoin treasury company buying — which provided meaningful support through late 2025 — is likely over, as valuations no longer support further expansion.
He now expects ETFs to be the primary price driver in 2026. That matters. The corporate bid is fading. The ETF bid has to replace it.
What the Monthly And Weekly Charts Reveal
BTCUSD (Monthly): As of May 23, 2026 (08:51 UTC), Bitcoin trades at $74,573, down -1.15% on the month.
The Parabolic SAR on the monthly chart sits below price — a macro bullish signal that has remained intact across the entire cycle from 2022 to now.
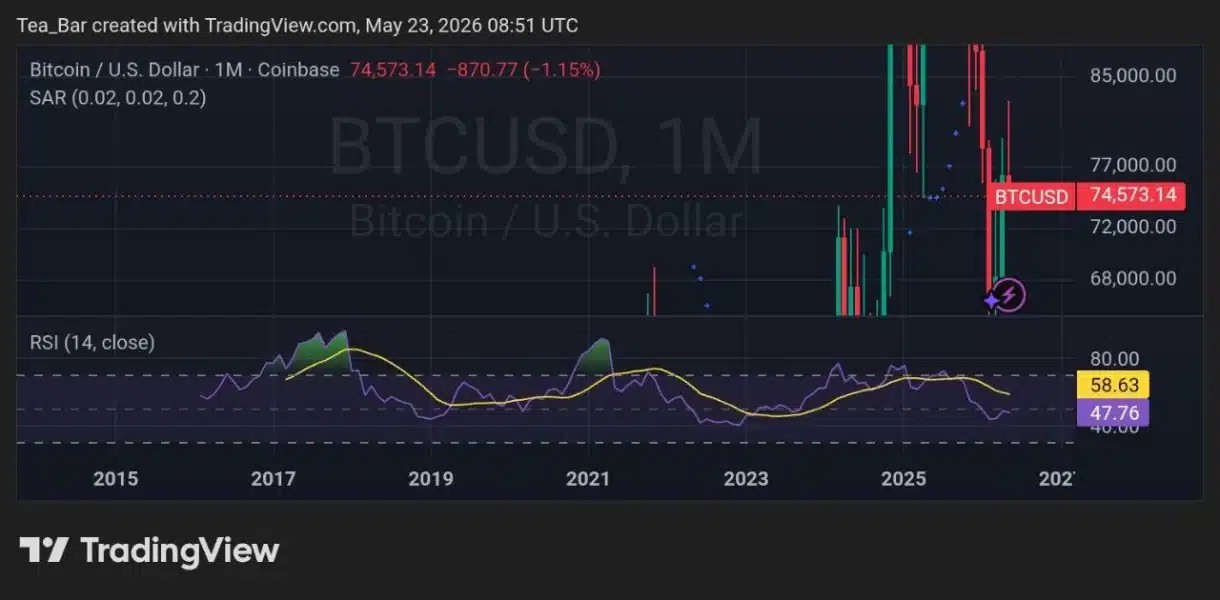
The RSI at 58.63 is declining from its signal at 47.76 — but both remain above the midline.
Looking at the full chart from 2015 to now, every major Bitcoin cycle low has occurred while the monthly RSI was above 40.
The current reading of 58.63 is not in that territory. The monthly structure remains bullish even as the shorter-term charts look weak.
BTCUSD (Weekly): Bitcoin trades at $74,572, down -1.16% on the week. The Parabolic SAR sits above price — the weekly trend has technically flipped bearish.
The RSI at 43.56 is declining from the signal at 38.17. Both are below the midline and falling. That is a bearish short-term setup. But context matters.
The weekly RSI was at 38 in February 2026 — the exact level that marked the capitulation low before the April-May recovery. The current reading is approaching that same zone.
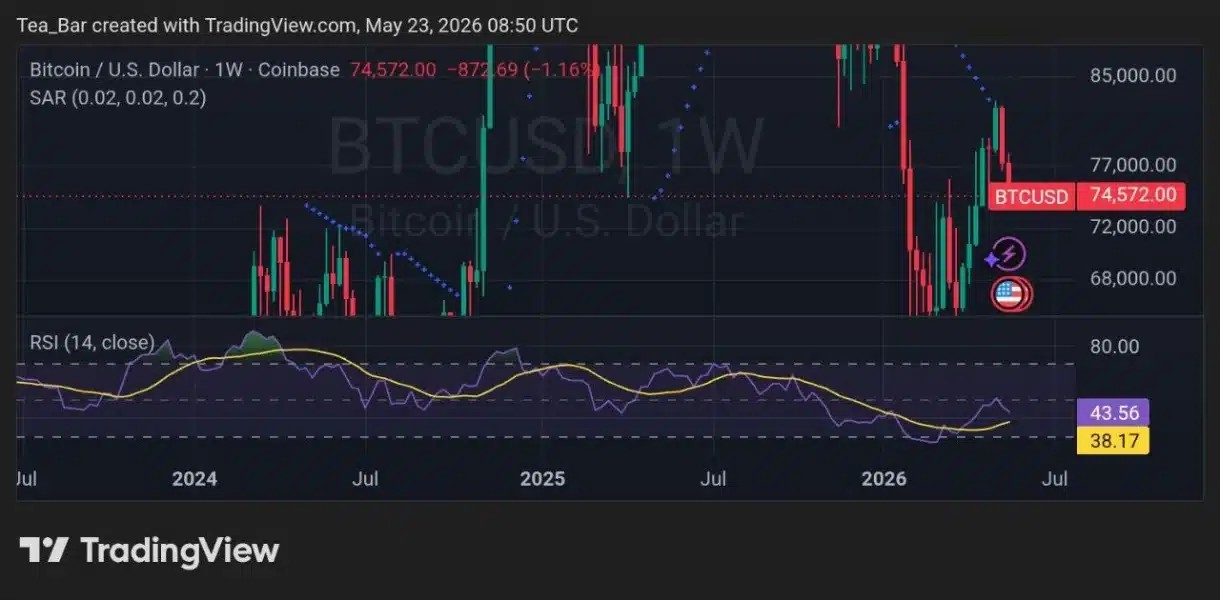
Whether the weekly RSI holds above 38 and turns upward — or breaks below it — is the technical question that defines the next four to six weeks.
What Traders Are Watching
Upside resistance levels are positioned at $78,500, $80,000, and $82,000 — the same levels that capped price in May.
If Bitcoin sustains above the $74K–$75K support and continues absorbing supply, a confirmed move above $80K–$82K could accelerate momentum toward the $88K–$95K range.
Three catalysts could break the stalemate in June — the CLARITY Act Senate floor vote, the Strategic Bitcoin Reserve announcement, and the Federal Reserve’s June meeting minutes.
None has arrived yet. Until one does, $74,000 is the number that matters most. It has held twice. Whether it holds a third time determines everything that follows.
Disclaimer:
This article is for informational purposes only and does not constitute financial, investment, or trading advice. The views expressed are based on publicly available data, market observations, and the author’s interpretation at the time of writing. Cryptocurrency markets are highly volatile and unpredictable, and past performance or current technical setups do not guarantee future results. Readers should conduct their own research and consult with a qualified financial advisor before making any investment decisions. TechGaged does not accept liability for any losses incurred based on the information presented.


