


 2
2
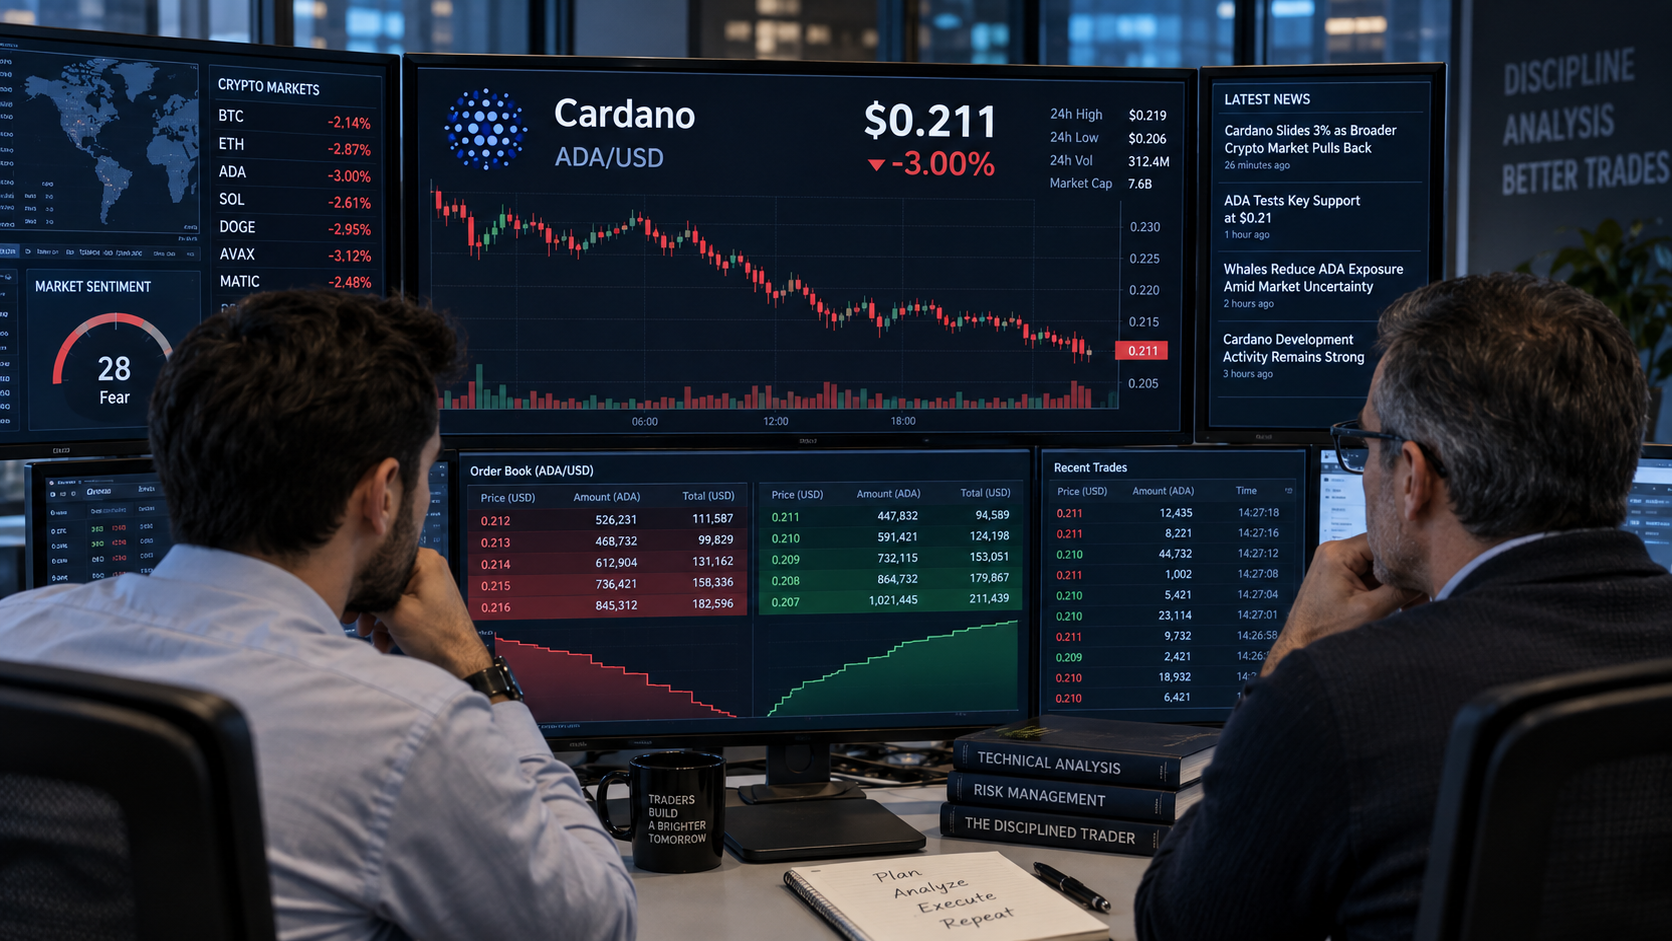
Cardano came under renewed selling pressure on Thursday, with $ADA falling nearly 5% as traders increased their activity across the cryptocurrency’s derivatives market.
$ADA traded at approximately $0.211 after losing 3% of its value over the previous 24 hours. The pullback placed the token close to the psychologically important $0.21 level, which could determine its near-term direction.
Futures trading outpaces spot activity
Cardano futures generated $651.78 million in 24-hour trading volume, significantly exceeding the $112.29 million recorded on spot markets.
Futures activity was nearly six times higher than spot volume, highlighting the strong influence of leveraged traders on $ADA’s latest price movement.
Elevated derivatives volume can increase volatility because leveraged positions may be liquidated when prices move sharply. This can amplify declines if long traders are forced to close their positions.
Open interest in Cardano futures stood at $445.52 million. The figure represents the total value of unsettled derivatives contracts and indicates that traders continue to maintain substantial exposure despite $ADA’s price decline.
$ADA’s ability to remain above $0.21 could now prove important. A sustained move below this level may encourage additional selling, particularly if highly leveraged long positions begin to unwind.
Conversely, stabilizing around the current price could allow buyers to absorb the selling pressure and attempt a recovery.
Traders will likely monitor changes in open interest, funding rates, and liquidation activity for clues about whether bearish momentum is strengthening or beginning to fade.
For now, the combination of a nearly 3% decline and elevated futures activity suggests that Cardano remains vulnerable to sharp short-term price swings.
Cardano holds the $0.21 support as bulls target $0.2467 breakout
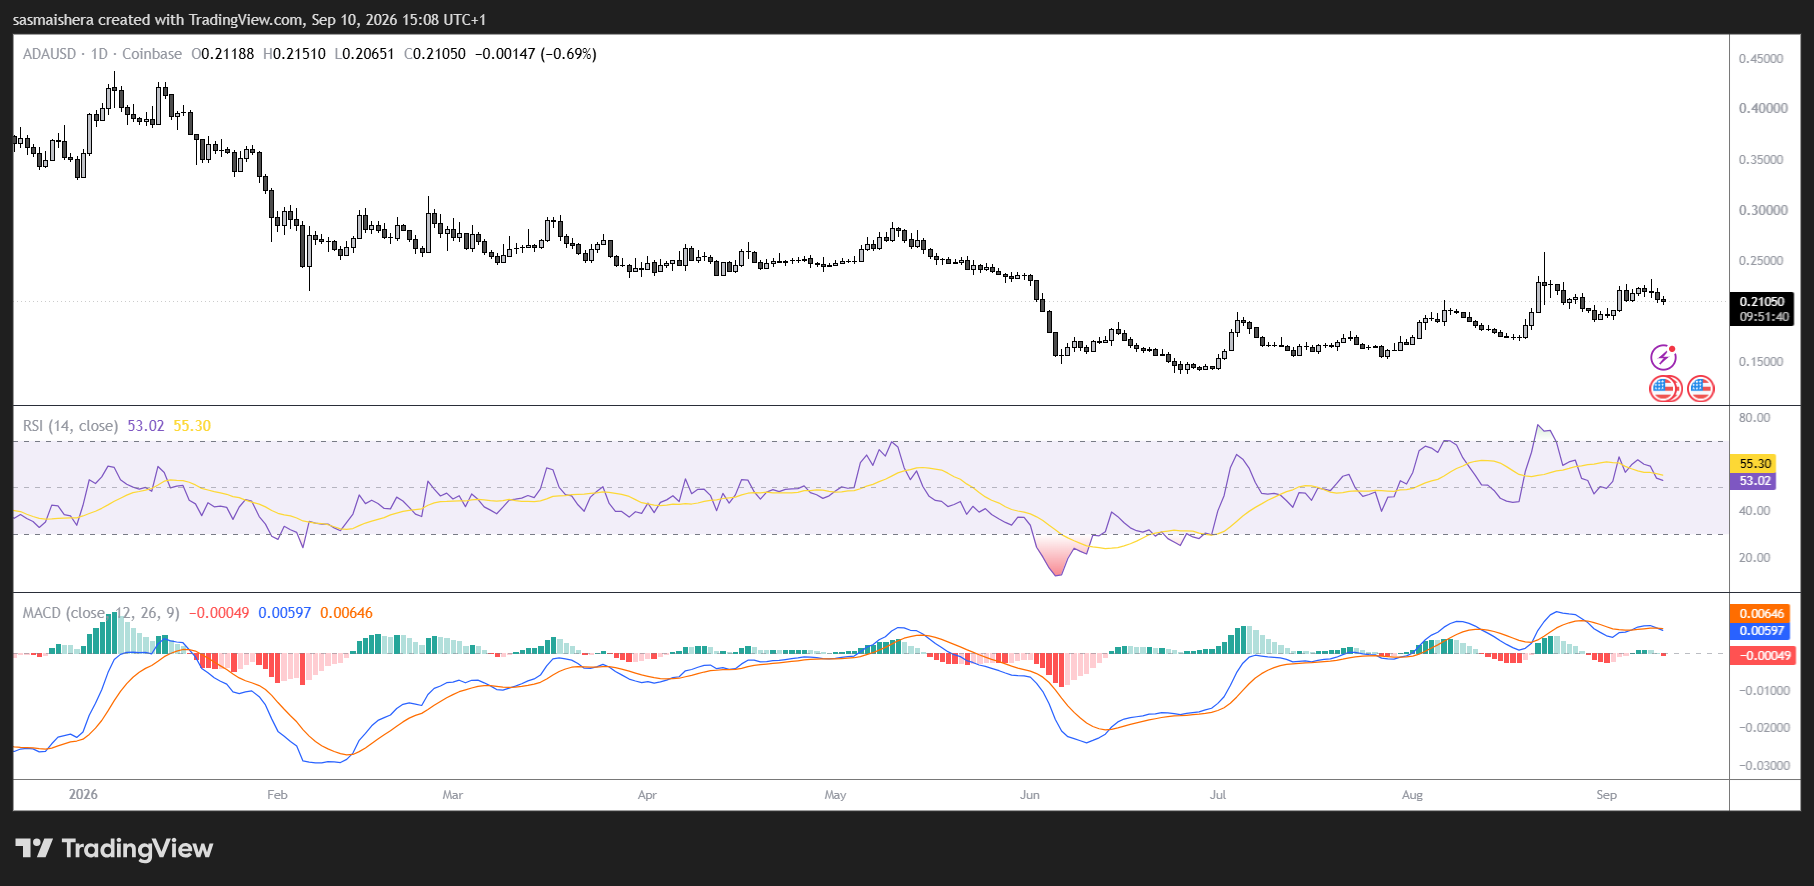
Cardano ($ADA) traded above $0.2100 on Thursday, edging lower after three consecutive bearish daily closes.
The token retains a constructive short-term structure above its 20-, 50- and 100-day exponential moving averages.
However, weakening momentum indicators suggest buyers may struggle to extend the recovery without a decisive breakout above nearby resistance.
Cardano continues to trade above its key short- and medium-term moving averages, which are clustered between $0.19 and $0.21.
The 20-day EMA at $0.2094 provides the most immediate support. $ADA’s ability to remain above this level suggests buyers are still defending the token following its recent pullback.
Holding above the broader moving-average cluster would preserve Cardano’s short-term bullish bias and give buyers another opportunity to challenge higher resistance.
$ADA’s most important overhead resistance zone sits between the 200-day EMA at approximately $0.2446 and the 78.6% Fibonacci retracement at $0.2467.
The Fibonacci level is measured from the decline between $0.2887 and $0.1385. Its close alignment with the 200-day EMA creates a concentrated resistance area that could attract significant selling pressure.
A confirmed breakout above $0.2467 would strengthen the bullish outlook and could allow Cardano to target the Fibonacci anchor near $0.2887.
Cardano’s Relative Strength Index stands near 55 on the daily chart. The reading reflects moderate bullish momentum and leaves room for additional gains before $ADA reaches overbought territory.
However, the Moving Average Convergence Divergence indicator has moved slightly below its signal line. This development suggests that upside momentum is weakening despite the token’s attempt to stabilize above $0.2100.
The conflicting indicators could keep $ADA consolidating until buyers or sellers establish clearer control.
If Cardano falls below the 20-day EMA at $0.2094, attention would shift to a concentrated support region near $0.20.
This zone includes the 100-day EMA at $0.2004, the 50% Fibonacci retracement at $0.1999, and the 50-day EMA at $0.1989.
The cluster of technical indicators could provide strong support during a deeper pullback.
However, a decisive close below this region would weaken Cardano’s constructive short-term structure and increase the risk of further losses.

 ambcrypto.com
 coinpedia.org