


Trading near $0.63 on September 8, 2026, Aerodrome Finance crypto finds itself caught between a powerful daily uptrend and growing short-term indecision. The broader crypto market capitalization slipped 3.02% over 24 hours, while the Fear & Greed Index holds at 69 in Greed territory.
Key takeaways
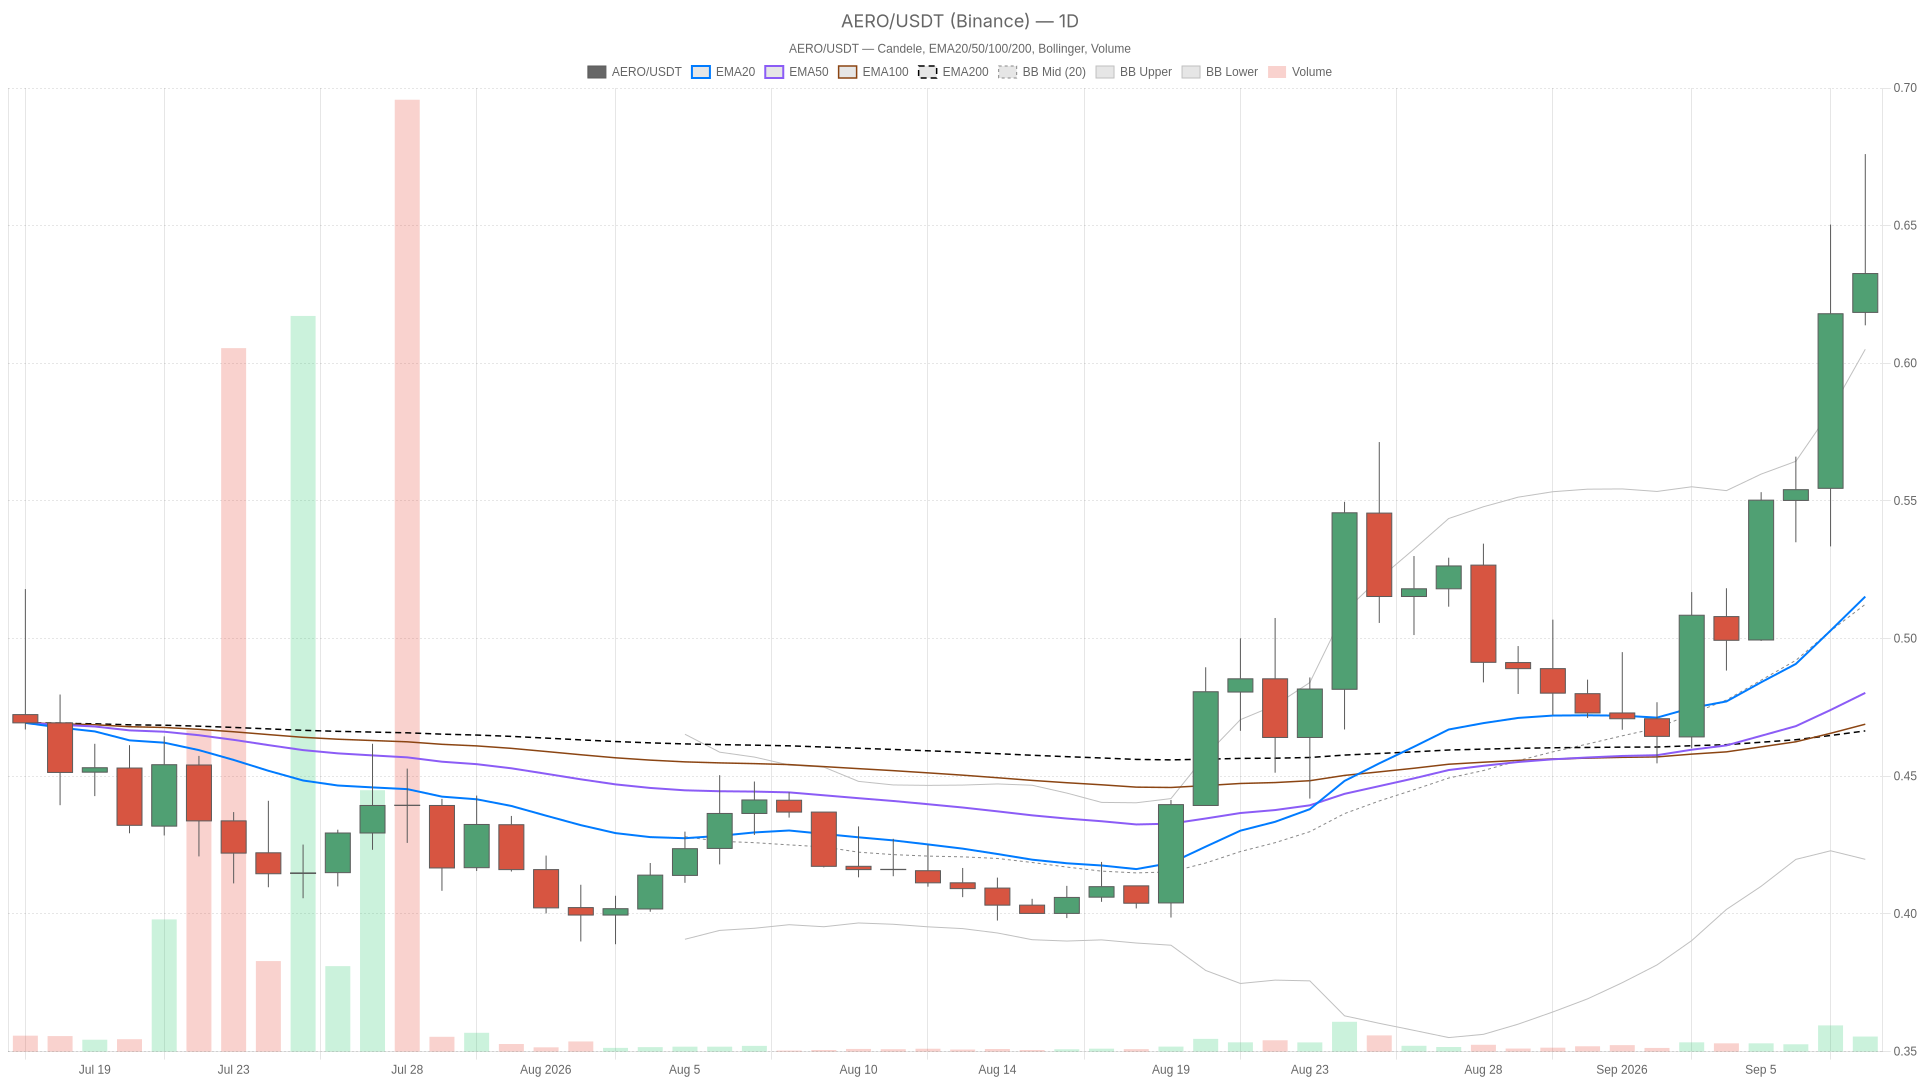
- $AERO/$USDT trades at approximately $0.63 as of September 8, 2026, with the daily EMA stack (20/50/200) fully bullish.
- Daily RSI14 sits at 75.17, deep in overbought territory, while price trades above the upper Bollinger Band at 0.61.
- The 1-hour chart retains a bullish regime but shows flat momentum, with MACD at 0.02/0.02 and histogram at zero.
- The 15-minute timeframe flips to neutral, with RSI at 46.37 and no directional conviction on the immediate tape.
- Key levels to watch: daily pivot at 0.64 for a bullish breakout, and support at 0.61 (s1) or 0.59 (1H EMA50) for a bearish pullback.
Daily trend remains structurally bullish but clearly overbought
The daily chart paints a structurally bullish picture for $AERO. The 20-period EMA at 0.52 sits above the 50-period at 0.48, which in turn sits above the 200-period at 0.47. This textbook bullish stack confirms the trend that has carried the token higher remains intact. Price at 0.63 trades well above all three moving averages.
However, the RSI14 on the daily chart sits at 75.17, deep into overbought territory. Combined with Bollinger Bands where the upper band rests at 0.61 and price has pushed to 0.63, the token is trading outside its own volatility envelope. That is not necessarily a sell signal, but it warns the move has gotten ahead of itself. A mean-reversion pause or pullback toward the band’s midline near 0.51 would not be surprising.
Meanwhile, the daily MACD remains constructive with the line at 0.04 above the signal at 0.02 and a positive histogram of 0.01. Momentum has not rolled over — it is simply decelerating relative to how stretched the RSI appears. ATR14 at 0.04 confirms this is a volatile instrument relative to its price. The daily pivot sits at 0.64, with resistance r1 at 0.67 and support s1 at 0.61, keeping price pinned just under a key decision point.
Lower timeframes reveal fading confirmation
The 1-hour chart still carries a bullish regime tag, and the EMA stack agrees: 20-period at 0.62 above 50-period at 0.59 above 200-period at 0.53, with price at 0.63 holding above all three. RSI14 here is a healthier 56.89, no longer overbought, suggesting the exhaustion signal on the daily chart is a higher-timeframe phenomenon rather than a confirmed shift across the board.
That said, the 1H MACD is essentially flat — line and signal both at 0.02, histogram at zero — meaning momentum has stalled rather than reversed. The 1H pivot cluster is extremely tight, with pp at 0.64, r1 at 0.64, and s1 at 0.63. This reinforces that price is coiled just below a critical decision level where neither side has committed.
On the 15-minute chart, the regime flips to neutral. RSI14 at 46.37 sits dead center, MACD is completely flat, and price oscillates around the EMA20 at 0.64 and EMA50 at 0.63. Bollinger Bands are tight at 0.62–0.65, and pivot levels stack around 0.63. The immediate tape carries no directional conviction — it is waiting for either the daily trend to reassert itself or overbought pressure to trigger a pullback.
Bullish and bearish scenarios for $AERO
The bullish case rests on the daily EMA stack holding and price reclaiming the daily pivot at 0.64 with enough follow-through to test r1 at 0.67. If the 1H MACD flips positive again and RSI climbs back above 60 while holding above the 0.62 EMA20, that would confirm buyers are stepping back in rather than the move fading. This scenario would be invalidated if $AERO loses the 1H EMA50 near 0.59 or breaks the daily EMA20 at 0.52.
Conversely, the mean-reversion case leans on the stretched daily RSI at 75.17 and price trading above the upper Bollinger Band. Historically, that kind of overextension resolves through sideways consolidation or a pullback toward daily s1 support at 0.61, and in a deeper retracement, toward the Bollinger midline around 0.51. The flat momentum on lower timeframes supports the idea that a pause is more likely right now than an immediate breakout. This scenario is invalidated if price pushes decisively through 0.64 and then 0.67 on rising volume.
What this means for market participants
The current setup for Aerodrome Finance crypto illustrates how a strong trend and a tired trend can coexist across different timeframes simultaneously. The daily chart has not broken down — far from it — but the overbought RSI and price sitting above its upper Bollinger Band are legitimate warnings that the current leg has run hot. Meanwhile, the 1H and 15m charts show momentum cooling without reversing, which often looks more like a pause before a decision than a top.
Volatility here is not trivial. ATR readings across timeframes confirm that moves of several percentage points can happen quickly, compounded by a broader market pulling back 3.02% in total capitalization even while sentiment readings stay in Greed territory at 69. That disconnect between macro sentiment and macro price action adds a layer of uncertainty that should not be ignored. Anyone tracking this setup should weigh both the daily trend structure and the short-term hesitation together, understanding that a break of the 0.64 pivot or a slide toward 0.59–0.61 support are the two levels likely to decide which story wins out next.
FAQ
What is the current price of $AERO?
As of September 8, 2026, $AERO/$USDT trades at approximately $0.63, sitting just below the daily pivot level of 0.64.
Is Aerodrome Finance’s $AERO token overbought?
On the daily timeframe, yes — the RSI14 reads 75.17, which is deep in overbought territory, and price trades above the upper Bollinger Band at 0.61. Lower timeframes show healthier readings, with the 1H RSI at 56.89 and the 15m RSI at 46.37.
What are the key support and resistance levels for $AERO?
The daily pivot at 0.64 serves as the immediate resistance, with r1 at 0.67. Support sits at s1 (0.61), with the 1H EMA50 at 0.59 and the daily Bollinger midline at 0.51 as deeper levels to monitor.
What is the broader market context for $AERO right now?
The total crypto market cap hovers near $2.67 trillion but dropped 3.02% in 24 hours, while Bitcoin dominance sits at 58.91% and the Fear & Greed Index reads 69 in Greed territory, according to CoinGecko-sourced aggregate data.
Disclaimer: This article is for informational purposes only and does not constitute financial advice, an investment recommendation, or a solicitation to buy or sell any financial instrument or cryptocurrency. The analysis provided is not indicative of future results. Investing in crypto assets and financial markets carries a high risk of capital loss. Always do your own research (DYOR) and consult a qualified financial advisor before making any decision.
Article produced with the assistance of artificial intelligence and reviewed by the editorial team.

 thecryptobasic.com

 u.today
 invezz.com
 ambcrypto.com