


 5
5
Historical data indicates that every time $XRP closes the first and second quarters of a year in losses, it stages a comeback in Q3.
$XRP has had a difficult 2026, but its past performance points to a possible recovery in the third quarter. Historical data shows that $XRP has recovered in Q3 whenever it suffered losses in both Q1 and Q2. This pattern occurred in 2014, 2018, and 2022.
$XRP Begins 2026 on a Bearish Note
$XRP entered 2026 at $1.8404, already in a downtrend that started in Q4 2025. At this point, the token was also nearly 50% below its $3.66 all-time high reached in July 2025.
While investors expected 2026 to bring an end to the decline, $XRP’s performance only got worse. The token recorded three straight monthly losses in Q1, falling 10.63% in January, 16.32% in February, and 2.63% in March 2026. These losses gave $XRP a 27.1% decline in Q1 2026.
This marked $XRP’s first Q1 loss since the 2022 bear market and its biggest Q1 decline since Q1 2018. For context, in that quarter, $XRP crashed 77.7% after falling from its $3.31 peak in January 2018.
Q2 Extends $XRP’s Decline
After the heavy Q1 loss this year, $XRP showed signs of a recovery at the start of Q2 2026. Specifically, prices gained 2.04% in April 2026, raising hopes that the downtrend that began in Q4 2025 had finally ended and that a broader reversal could be starting.
However, this recovery lost steam. $XRP fell 2.65% in May 2026, giving back all of its April gains. The decline became much sharper in June, when $XRP plunged 22%. The June loss marked its worst monthly decline since February 2025 and pushed $XRP to a 22.4% loss for Q2 2026.
Meanwhile, Q3 initially brought another small recovery, as $XRP gained 2.16% in July 2026. However, August has since erased the recovery. $XRP is currently down 2.24% this month, leaving it with a 0.10% decline in Q3 2026 so far.
Still, August remains weeks from closing, and Q3 has nearly two months left. As a result, $XRP has plenty of time to reverse its current loss and repeat its historical third-quarter recovery.
Historical Data
The most recent example of this pattern came during the 2022 bear market, which became worse after the Terra ecosystem triggered wider market contagion.
$XRP fell 2.14% in Q1 2022 before suffering a much larger 59.4% decline in Q2 2022. Despite those steep first-half losses, $XRP recovered in Q3. The token gained 44.5% in Q3 2022.
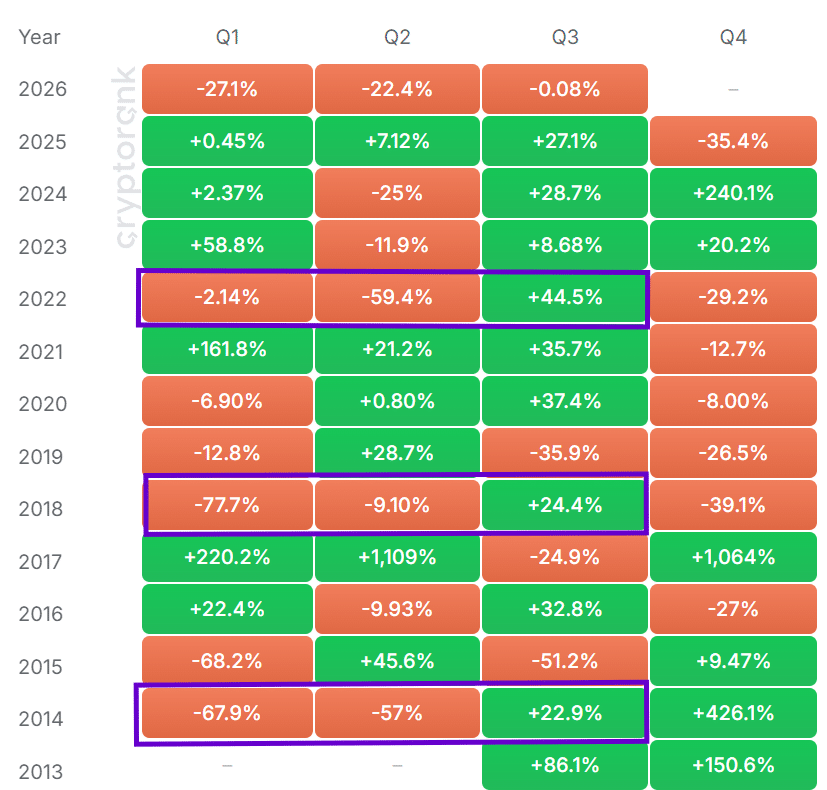
The same pattern appeared in 2018. Notably, $XRP dropped 77.7% in Q1 2018 and then fell another 9.10% in Q2 2018. However, the token recovered by 24.4% in Q3 2018. This means that both 2018 and 2022 produced a Q3 recovery after $XRP declined during the first two quarters of the year.
Also, in 2014, $XRP suffered a 67.9% decline in Q1 and then dropped another 57% in Q2. Despite the heavy losses, the price recovered in Q3, gaining 22.9% during the quarter.
What This Could Mean for $XRP in Q3 2026
Across 2014, 2018, and 2022, $XRP recorded an average 30.6% gain in Q3 after declining in both Q1 and Q2. If $XRP produces the same 30.6% increase in Q3 2026, its price could climb above $1.356 by the end of the quarter.
However, history does not guarantee that $XRP will repeat the pattern this year. The token could follow the trend but only see a mild gain in Q3 2026. It could also break from the pattern and record another quarterly loss. If the latter happens, $XRP would suffer three consecutive quarterly losses for the first time since its inception.
The broader crypto market could ultimately determine which path $XRP takes. Bitcoin remains especially important because its direction often influences $XRP and other altcoins.

 coindesk.com
 invezz.com