


 1
1
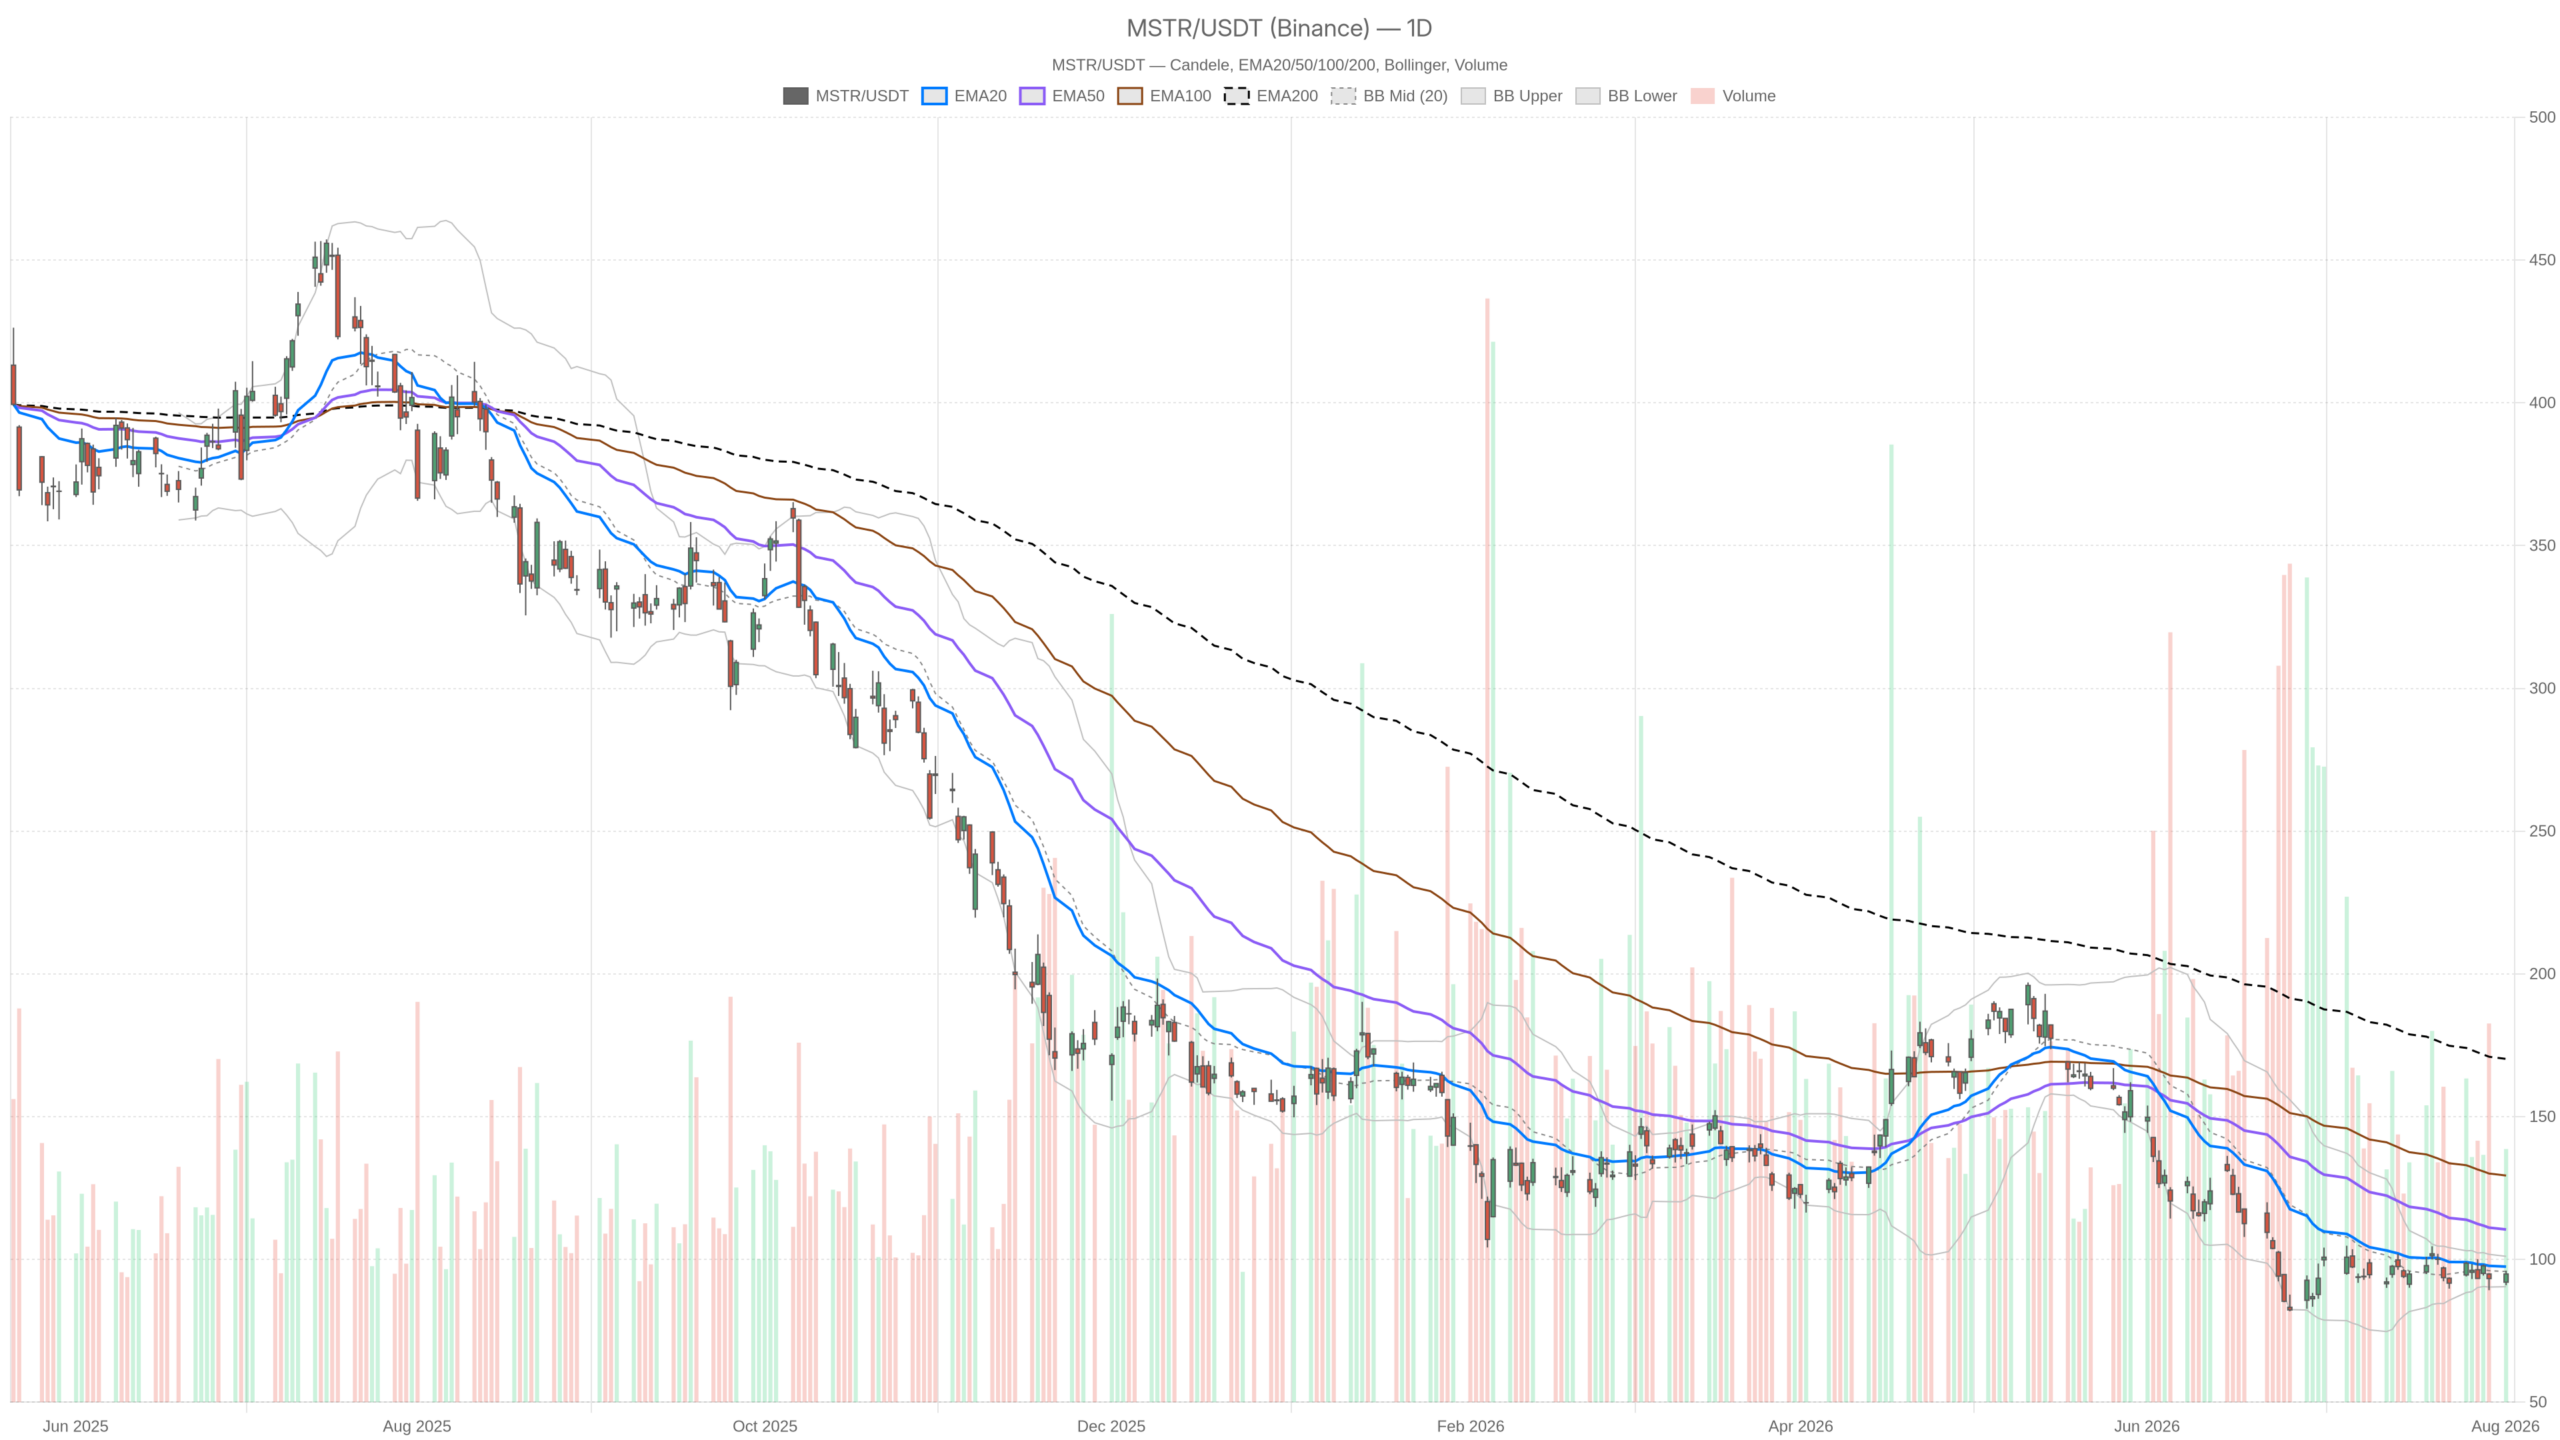
Strategy Stock (MSTR) closed at $94.86, trapped below all major daily moving averages in a stacked bearish alignment. The company’s recent $104 million Bitcoin sale at a loss adds fundamental pressure to an already fragile technical structure.
Key takeaways
- MSTR closed at $94.86, trading below the EMA20 ($97.46), EMA50 ($110.48), and EMA200 ($170.21)
- Daily RSI14 at 44.67 signals soft momentum without reaching oversold territory
- Strategy sold Bitcoin worth $104 million at an average price of $63,957 — below the $75,419 average acquisition cost
- The 1H timeframe shows early stabilization, but the daily bearish regime remains intact
- Key daily support sits at $91.84, with resistance at $96.97
Daily Trend Structure: Strategy Stock Momentum Still Fragile
Strategy Stock’s daily trend remains decisively bearish, with MSTR trading below all three major moving averages. The stacked EMA20 ($97.46), EMA50 ($110.48), and EMA200 ($170.21) confirm sellers are firmly in control.
Fundamental Context and EMA Stack
In recent sessions, the broader narrative around Strategy has shifted meaningfully. The company ended a four-week pause with a $104 million Bitcoin sale at roughly $63,957 per coin. That is well below its average acquisition cost near $75,419, marking a realized loss on treasury holdings. Meanwhile, Strategy’s Q2 earnings call centers on repairing STRC’s return to par and rebuilding a cash buffer. This is capital management under duress, not opportunistic accumulation.
Momentum, Volatility and Key Levels
On the daily timeframe, RSI14 sits at 44.67 — below the neutral 50 line but not yet oversold. This reflects soft momentum without outright capitulation. MACD is at -4.02 against a signal of -5.30, keeping the indicator firmly negative. However, the histogram has ticked up to 1.28. Downside momentum is narrowing, though a confirmed reversal remains absent.
Meanwhile, Bollinger Bands show price near the midline at 95.74. The upper band sits at 101.06, the lower at 90.42. This orderly positioning suggests movement without panic. Daily ATR14 at 5.87 confirms Strategy Stock remains a high-volatility name. Pivot levels define the near-term battle zone: pivot at 93.95, resistance at 96.97, and support at 91.84.
1H Timeframe: Confirmation With a Twist
The hourly chart largely confirms the bearish structure, but stabilization signals are emerging. Price at 94.80 sits below both the EMA50 (95.43) and EMA200 (99.79), yet rests essentially on top of the EMA20 (94.90). This suggests short-term consolidation rather than fresh directional selling.
Notably, RSI14 on the 1H is 49.02 — almost perfectly neutral. Momentum has flattened after the daily-driven decline rather than accelerating lower. MACD mirrors the daily pattern: line at -0.19, signal at -0.38, histogram at 0.19. Again, negative but narrowing. The H1 Bollinger midline at 94.78 closely matches current price, reinforcing a market pausing to digest recent moves. ATR14 on H1 is 2.11, notably lower than the daily reading, fitting a market that has slowed after the initial drop. Pivot resistance at 95.38 and support at 94.51 define a tight intraday range.
15-Minute Execution Context
The 15-minute chart reflects a market in a holding pattern. Price at 94.80 is sandwiched between the EMA50 (94.77) and EMA200 (95.39), with the EMA20 (95.03) sitting just above. RSI14 at 48.84 is dead center, and the MACD histogram registers a marginal -0.07 — essentially flat.
Meanwhile, Bollinger Bands are compressed between 94.33 and 95.81. ATR14 of just 0.62 confirms low short-term volatility. For execution purposes, the 15m pivot resistance at 95.27 and support at 94.57 mark the immediate boundaries. Traders are likely watching these levels before any larger move plays out.
Bullish Scenario for Strategy Stock
A bullish reversal for Strategy Stock would require more than a pause in selling — it demands a genuine momentum shift. If the daily MACD histogram continues expanding and the line closes toward its signal, that would mark real improvement beyond a temporary breather.
Still, a daily close back above the EMA20 at 97.46 would be the first concrete sign sellers are losing control. A subsequent push through pivot resistance at 96.97 would reinforce that shift. On the fundamental side, any indication that Strategy stabilizes STRC and rebuilds cash without further distressed Bitcoin sales would help. It would remove a key overhang currently weighing on sentiment.
Bearish Scenario: The Path of Least Resistance
The bearish case is already the path of least resistance given the daily regime. A break below daily support at 91.84, especially on rising volume, would confirm continuation of the broader downtrend. It would likely open the door toward the lower Bollinger Band near 90.42.
At the same time, the Bitcoin sale at a loss adds a layer of fundamental fragility. Combined with the pivot from steady accumulation toward capital preservation, technical bounces alone may not offset the damage. If H1 momentum rolls back over — RSI slipping below 49 and MACD histogram turning negative — that would invalidate any early bullish attempt. Daily-level bearish control would reassert itself.
Closing Take: Strategy Stock Demands Caution
Overall, Strategy Stock sits in a technically fragile but not collapsing position. The daily trend remains bearish, while the H1 timeframe shows early signs of stabilization. Meanwhile, the 15-minute chart reflects a market waiting for its next catalyst.
Volatility, measured by ATR across all three timeframes, remains elevated. Sharp moves in either direction should not be ruled out. Meanwhile, the underlying news flow keeps the fundamental backdrop uncertain. A Bitcoin sale at a loss, a pivot toward capital management, and skepticism about the Saylor model all weigh on sentiment. Given mixed momentum signals against a clearly bearish daily structure, positioning around MSTR demands caution rather than conviction.
FAQ
What is the current trend for Strategy Stock?
Strategy Stock is in a firmly bearish daily trend. MSTR trades below the EMA20 ($97.46), EMA50 ($110.48), and EMA200 ($170.21), forming a stacked bearish alignment that leaves little doubt about the dominant direction.
What does the recent Bitcoin sale mean for MSTR?
Strategy sold $104 million worth of Bitcoin at roughly $63,957 per coin, well below its average acquisition cost near $75,419. This realized loss signals capital management under duress rather than opportunistic accumulation, adding fundamental pressure to the stock.
What are the key support and resistance levels for Strategy Stock?
Key daily support sits at $91.84, with a break below potentially opening the door toward the lower Bollinger Band near 90.42. Resistance stands at $96.97, with a close above the EMA20 at $97.46 needed as a first sign of trend improvement.
Is Strategy Stock a buy at current levels?
Given mixed momentum signals against a clearly bearish daily structure, positioning around MSTR currently demands caution. The daily trend has not reversed, and fundamental overhangs from the Bitcoin sale at a loss persist. Confirmation of trend improvement is needed before considering long exposure.
Disclaimer: This article is for informational purposes only and does not constitute financial advice, an investment recommendation, or a solicitation to buy or sell any financial instrument or cryptocurrency. The analysis provided is not indicative of future results. Investing in crypto assets and financial markets carries a high risk of capital loss. Always do your own research (DYOR) and consult a qualified financial advisor before making any decision.
Article produced with the assistance of artificial intelligence and reviewed by the editorial team.

 ambcrypto.com

 coinpedia.org