


 1
1
Trump-linked World Liberty Financial extended its series of large on-chain transfers after ALT5 Sigma transferred 182.94 million $WLFI, worth approximately $10.07 million, to a new wallet.
The transaction followed the movement of 1.815 billion $WLFI, valued at nearly $99.77 million, recorded a day earlier.
Blockchain data also showed a small test transfer reaching the same destination before the larger transaction, repeating the transfer pattern observed previously.
However, the available on-chain records only confirm wallet-to-wallet activity and do not identify the receiving address as an exchange.
Therefore, the latest movement expands the sequence of treasury transfers without providing evidence that the tokens entered the open market.
$WLFI exchange supply tells a different story
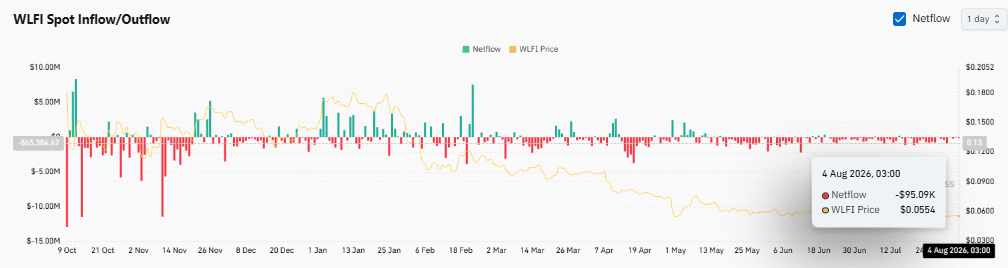
Despite the sizeable treasury transfers, Spot netflows remained negative at -$95.09K, indicating that more $WLFI continued leaving exchanges than entering them.
This reading limits the amount of immediately tradable supply instead of increasing exchange reserves.
Although the netflow value appears modest beside the multi-million-dollar wallet transfers, the two datasets point toward different conclusions.
Treasury wallets continue shifting funds, whereas exchange balances do not reflect a corresponding increase in available supply.
As a result, current on-chain evidence does not support the view that the latest transfers have translated into immediate selling pressure.
Can $WLFI reclaim the upper range?
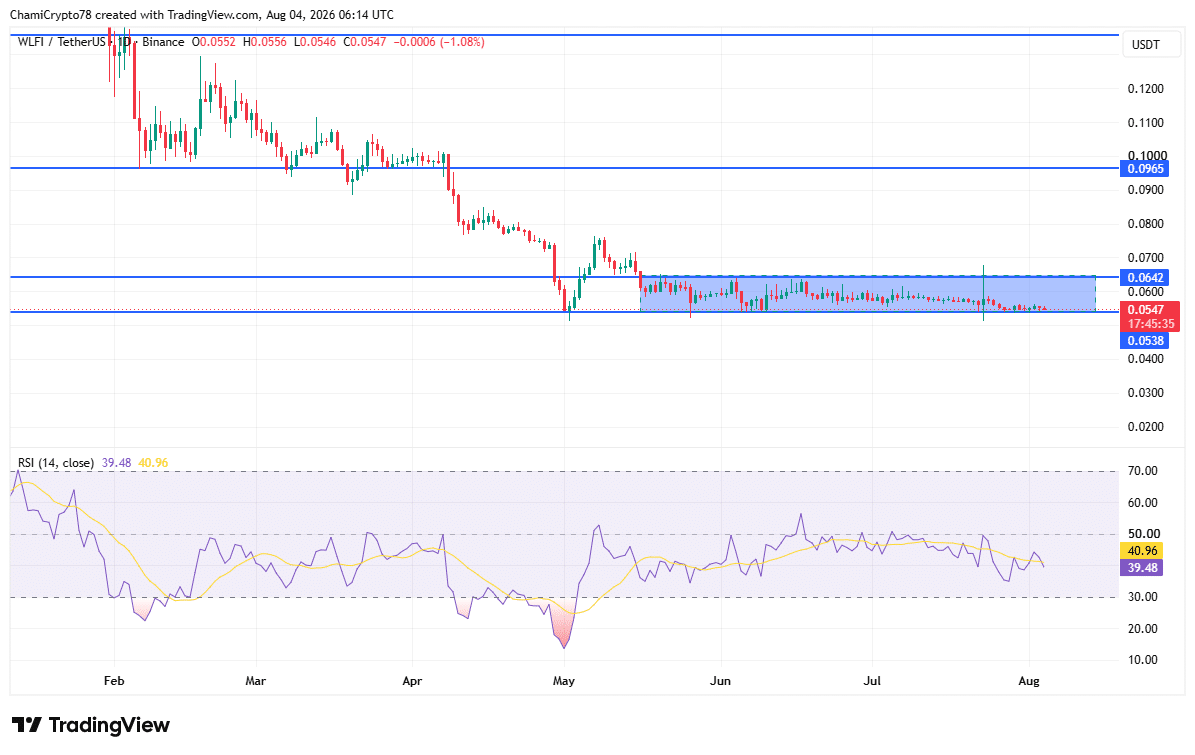
$WLFI’s price action continued favoring caution after the token failed to reclaim the $0.0642 resistance level. At press time, it traded near $0.0547, keeping the $0.0538 support zone under renewed pressure while remaining trapped inside its established range.
The RSI stood at 39.48, with its moving average near 40.96, leaving buying strength below the neutral 50 threshold.
Rather than reflecting oversold conditions, the indicator suggests buyers still lack sufficient conviction to reverse the prevailing structure. The chart also shows repeated rejection beneath resistance, strengthening the case that sellers continue defending higher prices.
Although support remains intact, buyers need to reclaim $0.0642 before the technical outlook shifts in their favor. Until then, sellers retain a slight structural advantage.
Liquidation map favors which side?
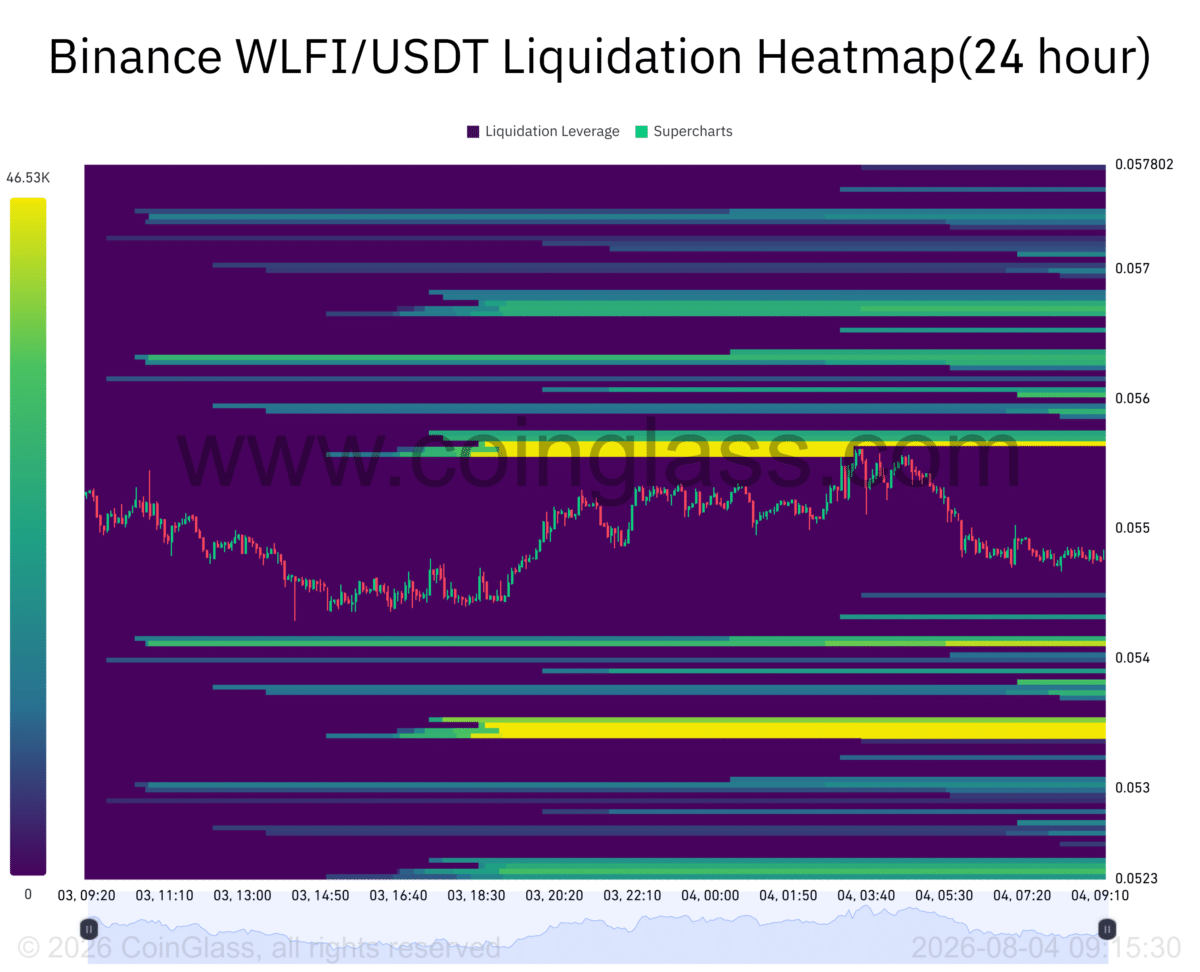
The Liquidation Heatmap reinforces the current technical picture.
The largest concentration of leveraged positions sits around $0.0558, while additional clusters extend toward $0.0560, $0.0568, and $0.0578, creating several layers of overhead liquidity.
Meanwhile, downside clusters appear near $0.0541, $0.0535, and $0.0523, although they remain less concentrated than those above the $WLFI price.
Such positioning suggests buyers would need to absorb greater liquidity before establishing a sustained recovery. Sellers, by comparison, require only a break beneath nearby support to expose the next downside pockets.
The liquidation landscape therefore aligns with the broader chart structure, which continues placing the burden of proof on buyers rather than signaling an imminent bullish reversal.
Final Summary
- Treasury transfers continued, but exchange supply stayed restrained as negative Spot netflows persisted.
- Sellers still held the technical edge while buyers struggled below the $0.0642 resistance.

 crypto.news
 thenewscrypto.com
 coinpedia.org