


 1
1
Sui’s price traded around $0.69, extending its sideways movement after a volatile month, maintaining consecutive lower highs and lows. The token has declined nearly 10% over the past month, with repeated selling pressure keeping it below key resistance despite several recovery attempts.
Price action has now tightened into a symmetrical triangle on the daily chart, reflecting growing indecision between buyers and sellers. Will this consolidation lead to a bullish breakout, or will bears force another leg lower? With $SUI approaching the triangle’s apex, its technical indicators and order flow data could provide clues about the token’s next directional move.
$SUI Technical Analysis: Triangle Formation Hints at a Potential Breakout
$SUI has spent much of July trading within a symmetrical triangle, forming lower highs while establishing higher lows after its sharp correction in June. This tightening price structure reflects a period of consolidation, with both buyers and sellers struggling to gain control as volatility continues to decline.
At the time of writing, $SUI was trading around $0.69, just above the triangle’s ascending support. The immediate resistance lies at $0.743, which aligns with the triangle’s upper trendline. A decisive daily close above this level could strengthen bullish momentum and expose the next resistance at $0.853. If buyers sustain the breakout, the token could extend its recovery toward $0.975 and $1.029.
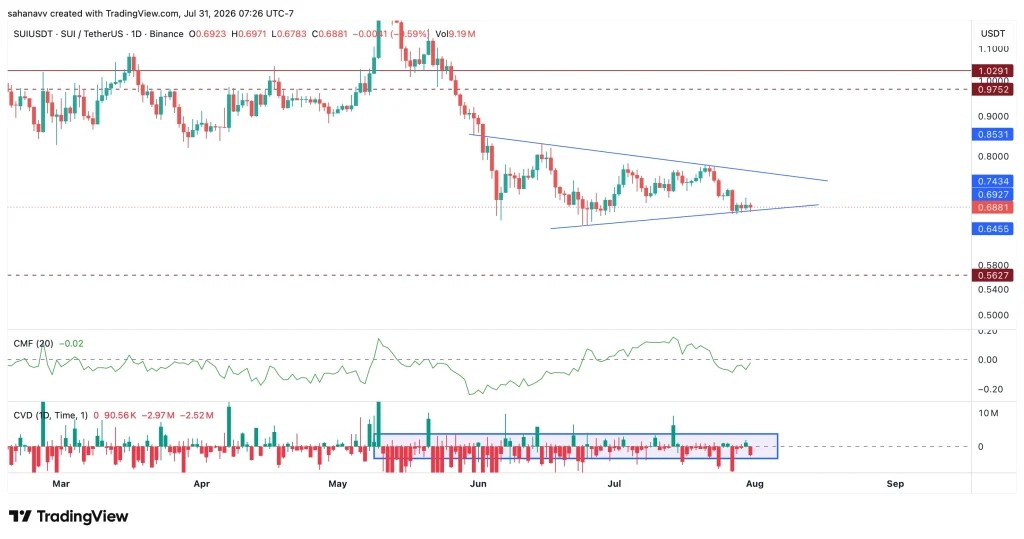
On the downside, the $0.645 support remains crucial for maintaining the current structure. A break below this level would invalidate the triangle pattern and increase the likelihood of a decline toward $0.563.
Meanwhile, the Chaikin Money Flow (CMF) remains just below the zero line, indicating that capital flows remain slightly tilted toward sellers, although the recent recovery suggests buying pressure is gradually improving. At the same time, the Cumulative Volume Delta (CVD) continues to hover in negative territory, signaling that aggressive selling still outweighs buying activity. However, the narrowing CVD range points to easing selling pressure, which could support a stronger directional move once $SUI breaks out of its current consolidation.
Can $SUI Price Reach $1?
$SUI price continues to consolidate within a symmetrical triangle, with the narrowing price range indicating that a decisive move could be approaching. While the improving CMF suggests buying pressure is gradually returning, the still-negative CVD shows sellers continue to hold a slight advantage, leaving the market without a clear directional bias.
A daily close above $0.743 could confirm a bullish breakout, opening the door for a move toward $0.853. If buying momentum strengthens further, $SUI may target $0.975, with $1.029 serving as the next major resistance.
Conversely, a break below $0.645 would invalidate the current consolidation pattern and shift momentum back in favor of the bears, potentially dragging the token toward $0.563. Until either level is breached, traders are likely to watch for confirmation before positioning for $SUI’s next major move.

 coinpaper.com
 en.cryptonomist.ch