


 2
2
The broader crypto market is applying relentless pressure on altcoins, and Ethena crypto is caught in the squeeze. As of July 31, 2026, $ENA sits pinned at $0.08 — a price level reflecting quiet exhaustion amid declining market conditions.
Key takeaways
- $ENA trades at $0.08 as of July 31, 2026, with daily RSI at 48.6 and MACD flat at zero across all readings.
- The Fear & Greed Index has cratered to 25, deep within Extreme Fear territory, while $BTC dominance holds above 56%.
- Bollinger Bands are fully compressed across daily, hourly, and 15-minute timeframes, signaling an imminent volatility expansion.
- The implosion of the Aschenbrenner AI hedge fund, which lost most of its $45 billion valuation, has rattled broader risk appetite.
- The 200-day EMA sits at $0.14 — nearly 75% above current price — reinforcing the bearish structural outlook.
Daily Chart: A Bearish Regime With Nowhere to Hide
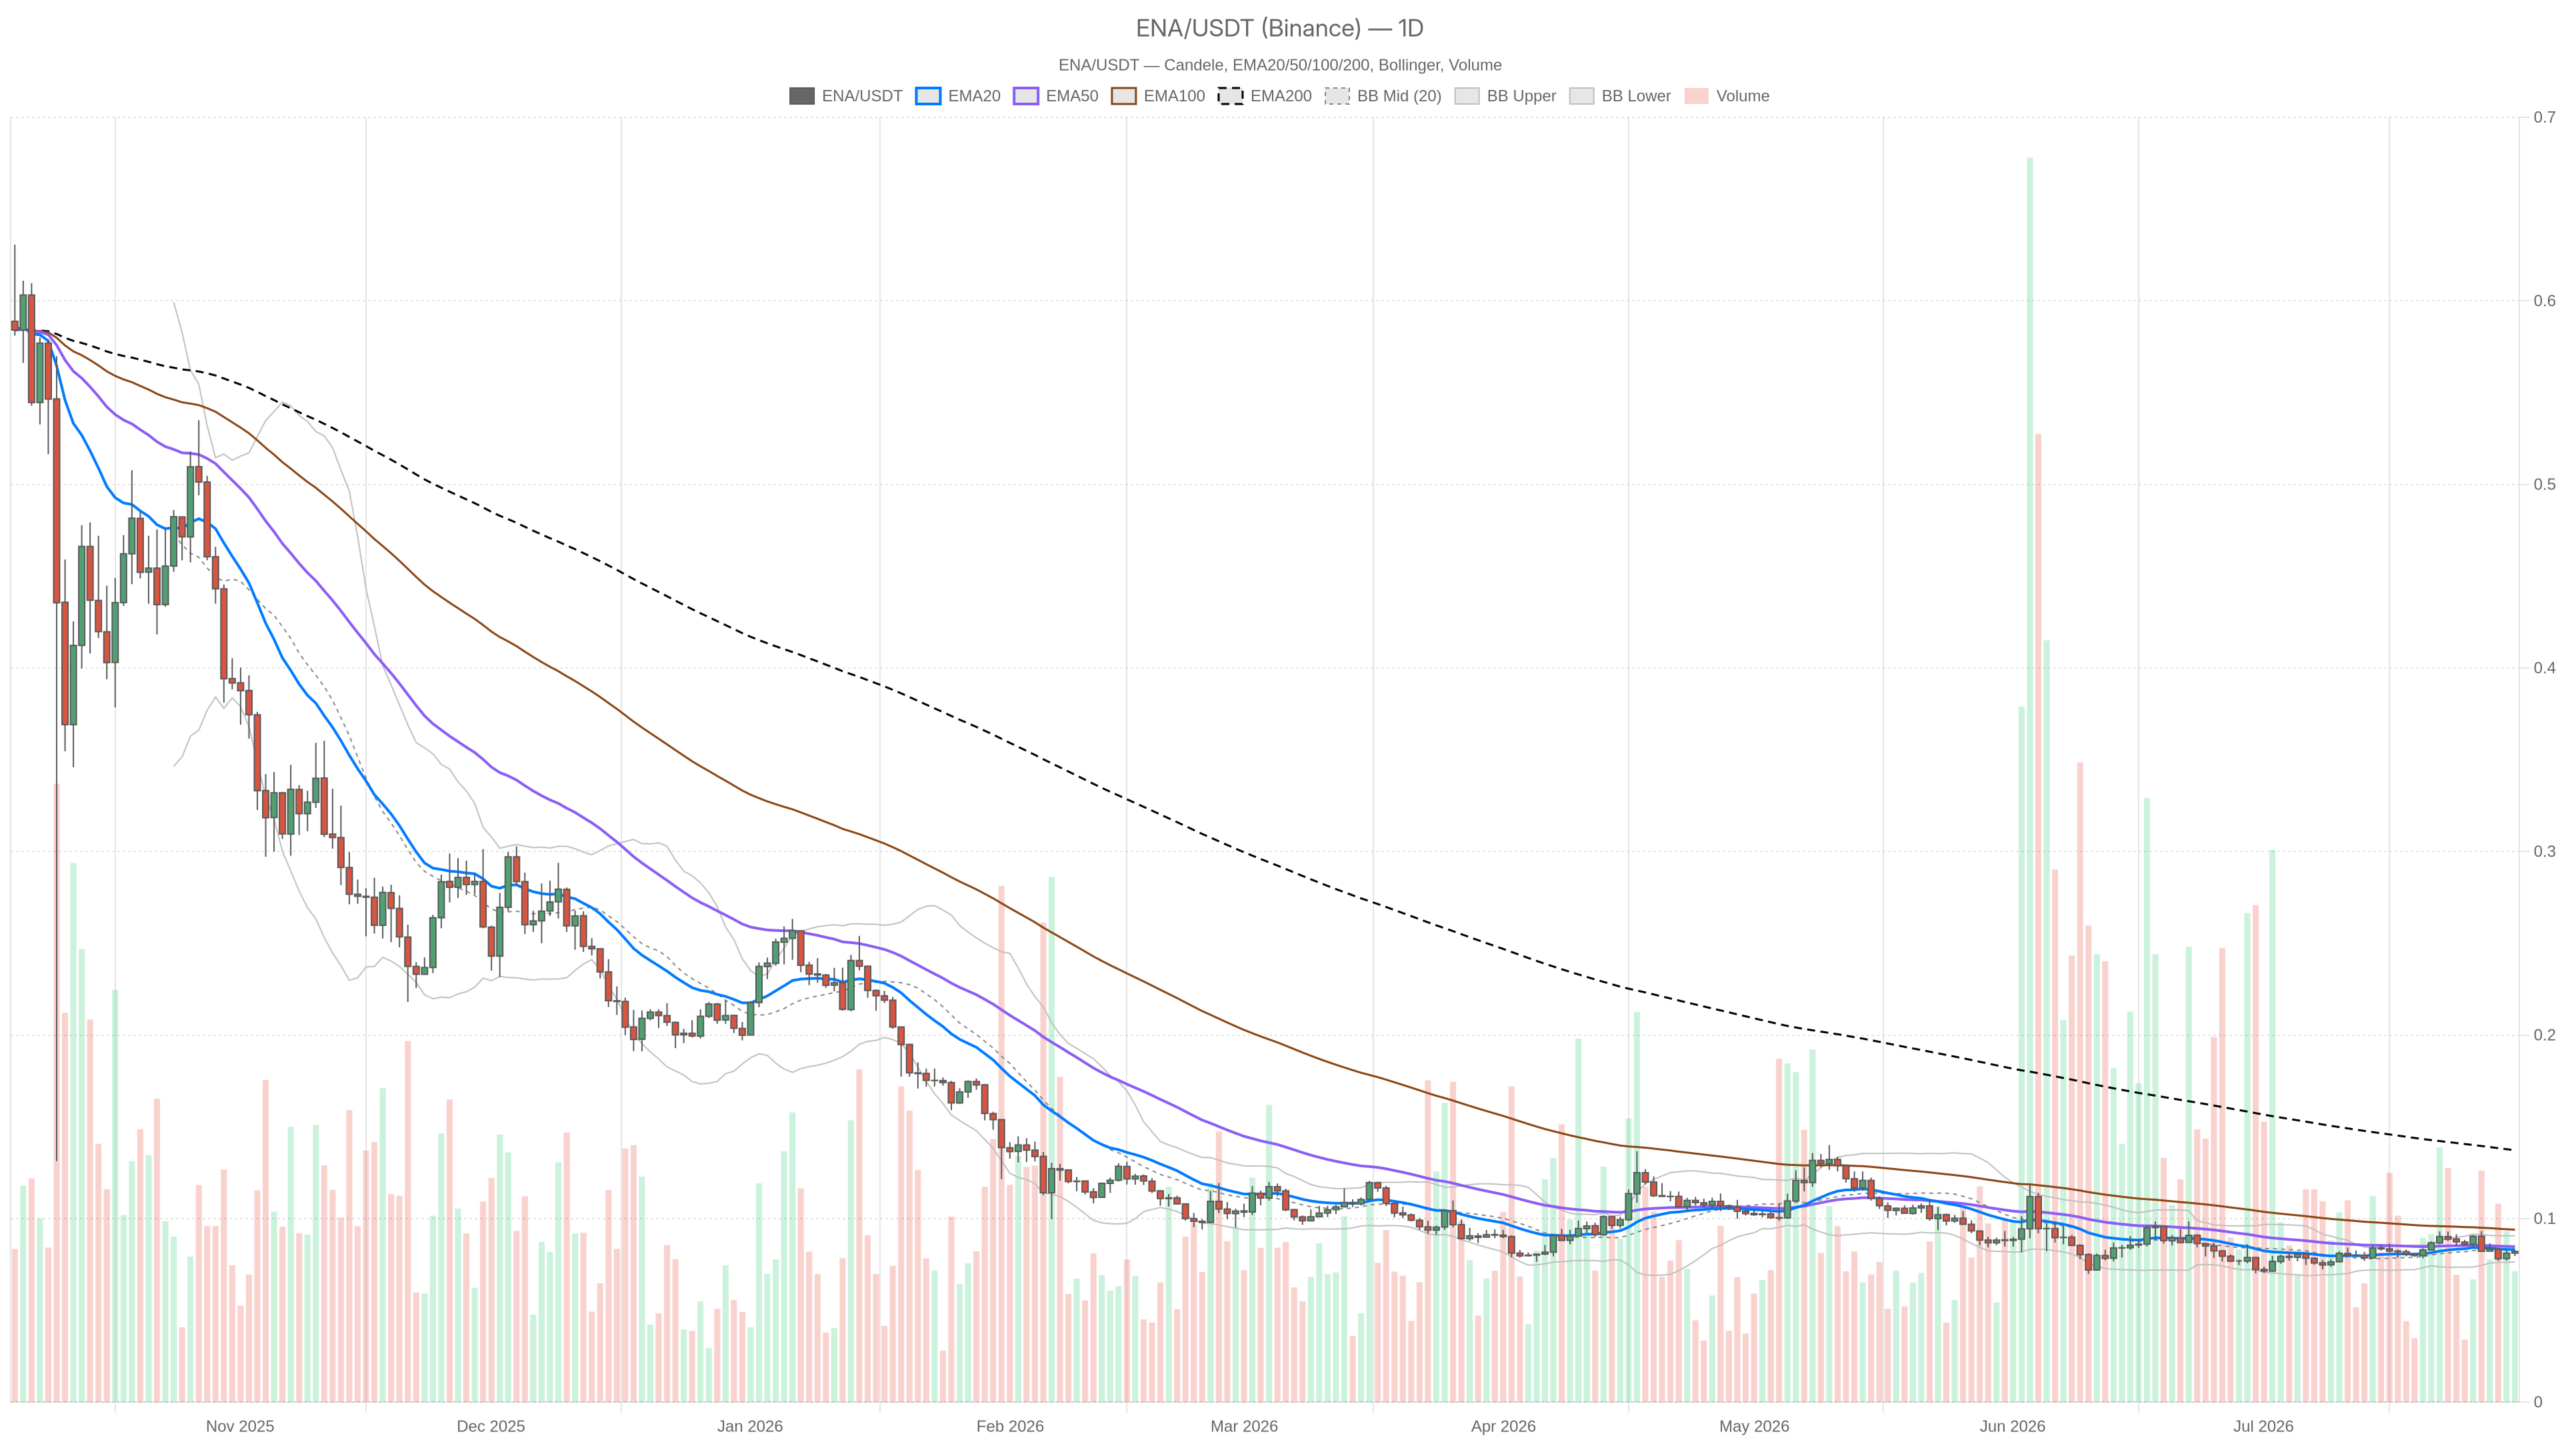
The daily chart regime is classified as bearish, and the evidence leaves little room for debate. The 20-day and 50-day EMAs both sit at $0.08 — the current price — offering zero dynamic support or resistance. More concerning is the 200-day EMA at $0.14, nearly 75% above current levels. That gap is not a recovery target; it underscores how far $ENA has fallen from its structural baseline.
The RSI on the daily timeframe is at 48.6 — just below the neutral midpoint of 50. This is not oversold territory, but neither is it recovering. It characterizes an asset in stasis: not panicking, yet attracting no meaningful buying pressure. The MACD line, signal, and histogram are all effectively at zero, registering no directional momentum on the daily chart at all.
Moreover, the MACD flatline at this level is arguably more concerning than a bearish cross. It suggests that neither bulls nor bears are committing capital. In a bearish macro environment, indecision of this kind tends to resolve to the downside. The Bollinger Bands reinforce this read: the midline, upper band, and lower band are all at or near $0.08, signaling extreme compression.
This level of compression does not last forever. It precedes a volatility expansion, and the direction of that expansion will define $ENA’s next decisive move. The ATR at $0.01 confirms the current low-volatility environment, but this can shift quickly once a catalyst emerges.
Hourly and 15-Minute Timeframes: A Flicker of Relative Strength
Drop down to the 1H chart, however, and the picture is marginally more constructive — though not enough to override the daily bias. The hourly regime is neutral, with RSI at 55.18 suggesting intraday buyers have been slightly more active than sellers. All four EMAs on the hourly are flat at $0.08, meaning $ENA is not in a downtrend but is not breaking out either.
The Bollinger Bands on the hourly have also compressed, with all three bands sitting at $0.08. Zero volatility on the short-term timeframe confirms the market remains in a holding pattern. Meanwhile, the 15-minute chart pushes RSI further to 60.66 — the highest reading across all timeframes — but this reads more like noise within a tight range than genuine momentum.
With ATR at zero and Bollinger Bands fully compressed on the 15m as well, there is no execution edge until a catalyst forces a breakout. The pivot levels across all three timeframes are essentially redundant: support, resistance, and the pivot itself have become indistinguishable. This is consolidation at the edge of a ledge, not a reliable base.
The Two Scenarios That Matter
The bullish case for Ethena crypto is conditional, but it exists. If Bollinger Band compression resolves to the upside — driven by a broader risk-on rotation or a protocol-specific catalyst — the first logical target is $0.09. Beyond that, a sustained move would need to clear and hold this level before approaching the $0.14 zone where the 200-day EMA sits.
For this scenario to gain credibility, the daily RSI must reclaim and hold above 50, and the MACD needs to show any sign of positive divergence. A recovery in broader sentiment — with the Fear & Greed Index moving back toward neutral — would be a necessary supporting condition. A daily close below $0.08 on expanding volume would invalidate the bullish case entirely.
Conversely, the bearish case aligns more closely with the current regime. If the market continues bleeding in a $BTC-dominant environment and Extreme Fear persists, $ENA has no fundamental reason to hold $0.08 with conviction. A breakdown with daily RSI slipping below 45 would suggest sellers are starting to press the issue. Even a modest bearish extension could push price into technically undefined territory.
That said, what would invalidate the bear case? A sharp, volume-driven reclaim of $0.09 with a corresponding shift in the daily MACD histogram turning positive. That would change the structural read meaningfully. Until then, the bias remains tilted toward the downside given the macro environment.
How to Approach Positioning Here
Overall, this is a genuinely difficult market for altcoin positioning. The Extreme Fear reading of 25 on the Fear & Greed Index, declining total market capitalization, and $BTC dominance at 56.2% all point to a market unwilling to take speculative risk on mid-cap tokens. $ENA’s near-zero ATR and compressed Bollinger Bands signal that volatility is coming, but timing and direction remain unknown.
Entering a position ahead of a volatility expansion in a bearish macro regime carries asymmetric downside risk. Patient traders will likely want to see either a confirmed breakout above $0.09 with daily momentum confirmation, or a deeper flush creating more compelling risk/reward at lower levels. The current price of $0.08 is not a setup — it is a waiting room.
The next significant move will be defined by whichever force breaks this compression first. Until then, the risk lies in assuming the outcome before the market reveals it. With the 200-day EMA looming at $0.14 and all short-term indicators flat, conviction in either direction remains absent.
FAQ
What is the current price of Ethena crypto?
As of July 31, 2026, $ENA trades at $0.08. The price has been pinned at this level with extremely low volatility, as indicated by an ATR of $0.01 and fully compressed Bollinger Bands across daily, hourly, and 15-minute timeframes.
Is $ENA in a bearish or bullish trend?
The daily chart regime is classified as bearish. The RSI sits at 48.6, below the neutral 50 mark, and the MACD is flat at zero with no directional momentum. The 200-day EMA at $0.14 sits nearly 75% above the current price, reinforcing the structurally bearish outlook.
What needs to happen for $ENA to stage a recovery?
A bullish reversal would require a volume-driven breakout above $0.09, the daily RSI reclaiming and holding above 50, and the MACD showing positive divergence. Broader market sentiment would also need to improve, with the Fear & Greed Index moving away from Extreme Fear territory toward neutral readings.
What is the near-term outlook for $ENA?
The near-term outlook is dominated by extreme Bollinger Band compression, which historically precedes a sharp volatility expansion. Until a catalyst forces a directional breakout, $ENA is likely to remain rangebound near $0.08. The macro environment — marked by $BTC dominance above 56% and persistent Extreme Fear — currently favors the bearish scenario.
Disclaimer: This article is for informational purposes only and does not constitute financial advice, an investment recommendation, or a solicitation to buy or sell any financial instrument or cryptocurrency. The analysis provided is not indicative of future results. Investing in crypto assets and financial markets carries a high risk of capital loss. Always do your own research (DYOR) and consult a qualified financial advisor before making any decision.
Article produced with the assistance of artificial intelligence and reviewed by the editorial team.

 cryptopotato.com
 newsbtc.com

 coinpaper.com

