


 12
12
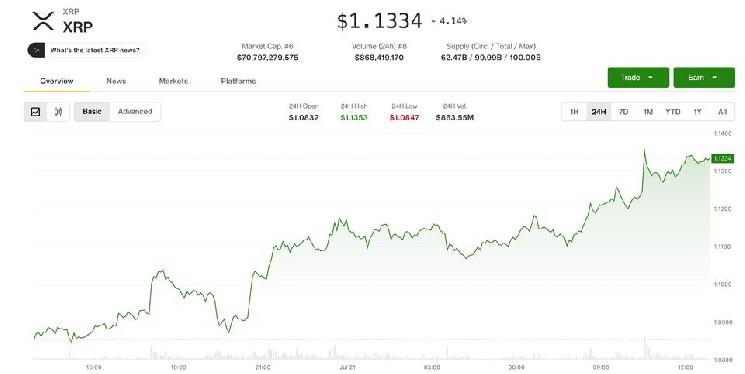
$XRP is trying to turn a support defense into a breakout. The token rose more than 4% over 24 hours and pushed toward $1.13, the level traders are watching after price compressed inside a short-term symmetrical triangle.
A move through that area could open the path toward $1.35, but the bigger daily chart still shows $XRP trading inside a descending channel that has capped rallies for months.
News Background
• $XRP traded near $1.13 on Monday, up about 4.6% over 24 hours, according to CoinGecko data.
• The token’s 24-hour range stretched from $1.08 to $1.14, with market capitalization near $70.85 billion and 24-hour trading volume around $1.27 billion.
• Analyst Ali Martinez said on X that $XRP’s monthly chart is showing a TD Sequential buy signal, while the hourly chart shows price consolidating inside a symmetrical triangle.
• Martinez said a breakout above $1.13 could open the door to a roughly 20% rally toward $1.35.
Price Action Summary
• $XRP opened near $1.0925 and climbed as high as $1.1067 on CoinDesk Data’s 24-hour chart before extending toward $1.13 on CoinGecko.
• The move followed several hours of sideways trading between roughly $1.09 and $1.11 before buyers pushed price higher in the morning session.
• Volume increased during the breakout attempt, with CoinGecko showing 24-hour trading volume of about $1.27 billion.
• $XRP held above the $1.08-$1.10 area through the session, keeping the short-term recovery structure intact.
Technical Analysis
• The key short-term level is $1.13. A sustained break above it would confirm the triangle breakout watched by traders and bring $1.35 into focus.
• The hourly structure has tightened into a symmetrical triangle, with price compressing between lower highs and higher lows before the latest push higher.
• The daily chart remains more cautious. $XRP is still trading inside a descending channel, with the 100-day and 200-day moving averages above price and sloping lower.
• The $1.24-$1.28 area remains the bigger resistance zone because it lines up with the channel’s upper boundary and major moving averages.
• Support remains strongest around $1.02-$1.06, where buyers have repeatedly stepped in over recent weeks.
What traders should watch
• $1.13 is the immediate breakout level. Holding above it would strengthen the short-term bullish setup.
• $1.14 is the next nearby level after marking the top of the latest 24-hour range.
• $1.24-$1.28 is the major resistance zone that $XRP needs to clear before the daily chart turns meaningfully stronger.
• $1.02-$1.06 remains the key demand zone. Losing it would expose $0.88-$0.92.

 en.bitcoinsistemi.com
 coinedition.com
 thecryptobasic.com