


 6
6
Shiba Inu is showing renewed signs of weakness as its current price action closely resembles a bearish setup that unfolded in 2023.
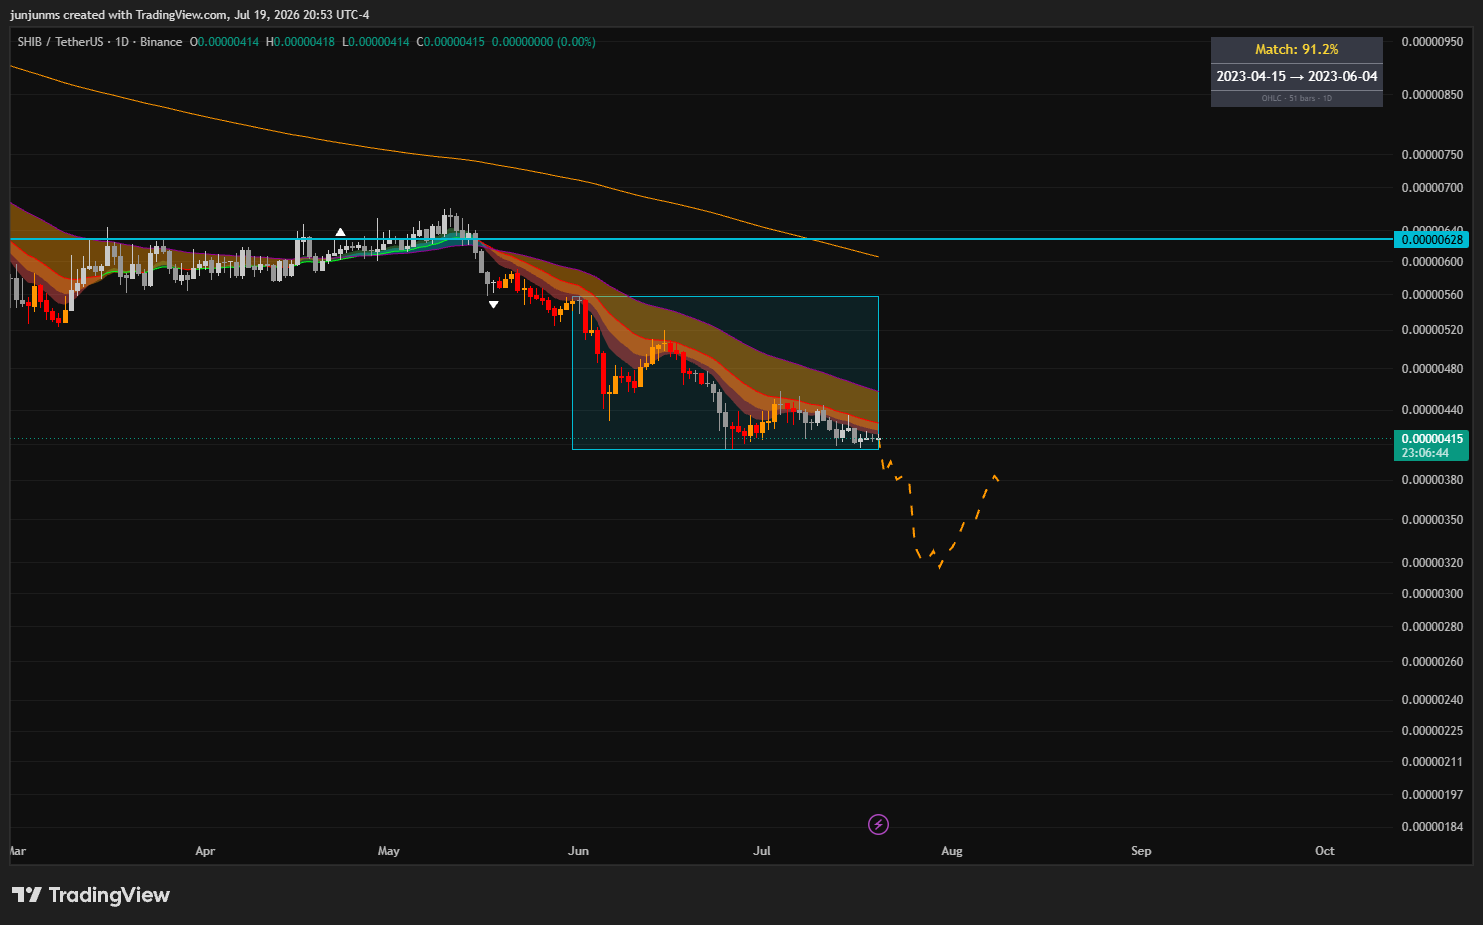
According to analysts, Shiba Inu’s recent market structure shares a 91.2% similarity with the price pattern recorded between April and June 2023, increasing the possibility of another downside move before any meaningful recovery.
For context, $SHIB has remained in a prolonged downturn since losing the critical $0.00000628 support level in May 2026. Following that rejection, $SHIB has continued to print lower highs and lower lows, confirming that sellers remain firmly in control of the market.
Price Action Suggests More Downside
As the bearish momentum persists, $SHIB has fallen below $0.0000042 and is now trading around $0.00000415, close to the lower boundary of its recent consolidation range.
Notably, this price structure closely mirrors $SHIB’s performance between April and June 2023. During that period, the token traded sideways for several weeks before breaking lower and eventually establishing a local bottom. The current setup suggests that a similar sequence may be unfolding once again.
Based on the projected historical pattern, analysts expect $SHIB could decline toward the $0.0000032–$0.0000033 support zone through late July and into August 2026. From the current price of $0.00000415, such a move would represent a decline of roughly 20%.
Recovery Remains Possible After Support Test
Despite the bearish outlook, the projected pattern also indicates that $SHIB could stage a rebound after testing the expected support area.
If buyers step back into the market and overall sentiment improves, Shiba Inu could recover toward the $0.0000038–$0.0000040 range. However, a stronger bullish reversal would require $SHIB to reclaim key resistance levels.
Specifically, the token would need to break above the $0.0000044–$0.0000045 resistance zone before targeting the more significant $0.0000055–$0.0000056 area.
Historical Pattern Is a Guide, Not a Guarantee
If the historical comparison continues to play out, $SHIB could establish another local low before beginning a more sustained recovery. However, while the 91.2% pattern match highlights a credible short-term bearish scenario, it does not guarantee that the token will follow its 2023 trajectory exactly.
At the time of writing, Shiba Inu has posted a modest 3.23% gain over the past 24 hours and 3.69% over the past week. Trading activity has also picked up, with $SHIB’s 24-hour trading volume rising 7.58% to $55.46 million. Despite the recent recovery, however, Shiba Inu remains outside the top 30 largest cryptocurrencies by market cap. The token currently ranks 32nd globally, with a market capitalization of approximately $2.46 billion.

 ambcrypto.com

 invezz.com
 crypto.news