


 5
5
Dogecoin has repeated a chart structure that has appeared before some of its biggest historical moves, with analysts pointing to a possible price rally.
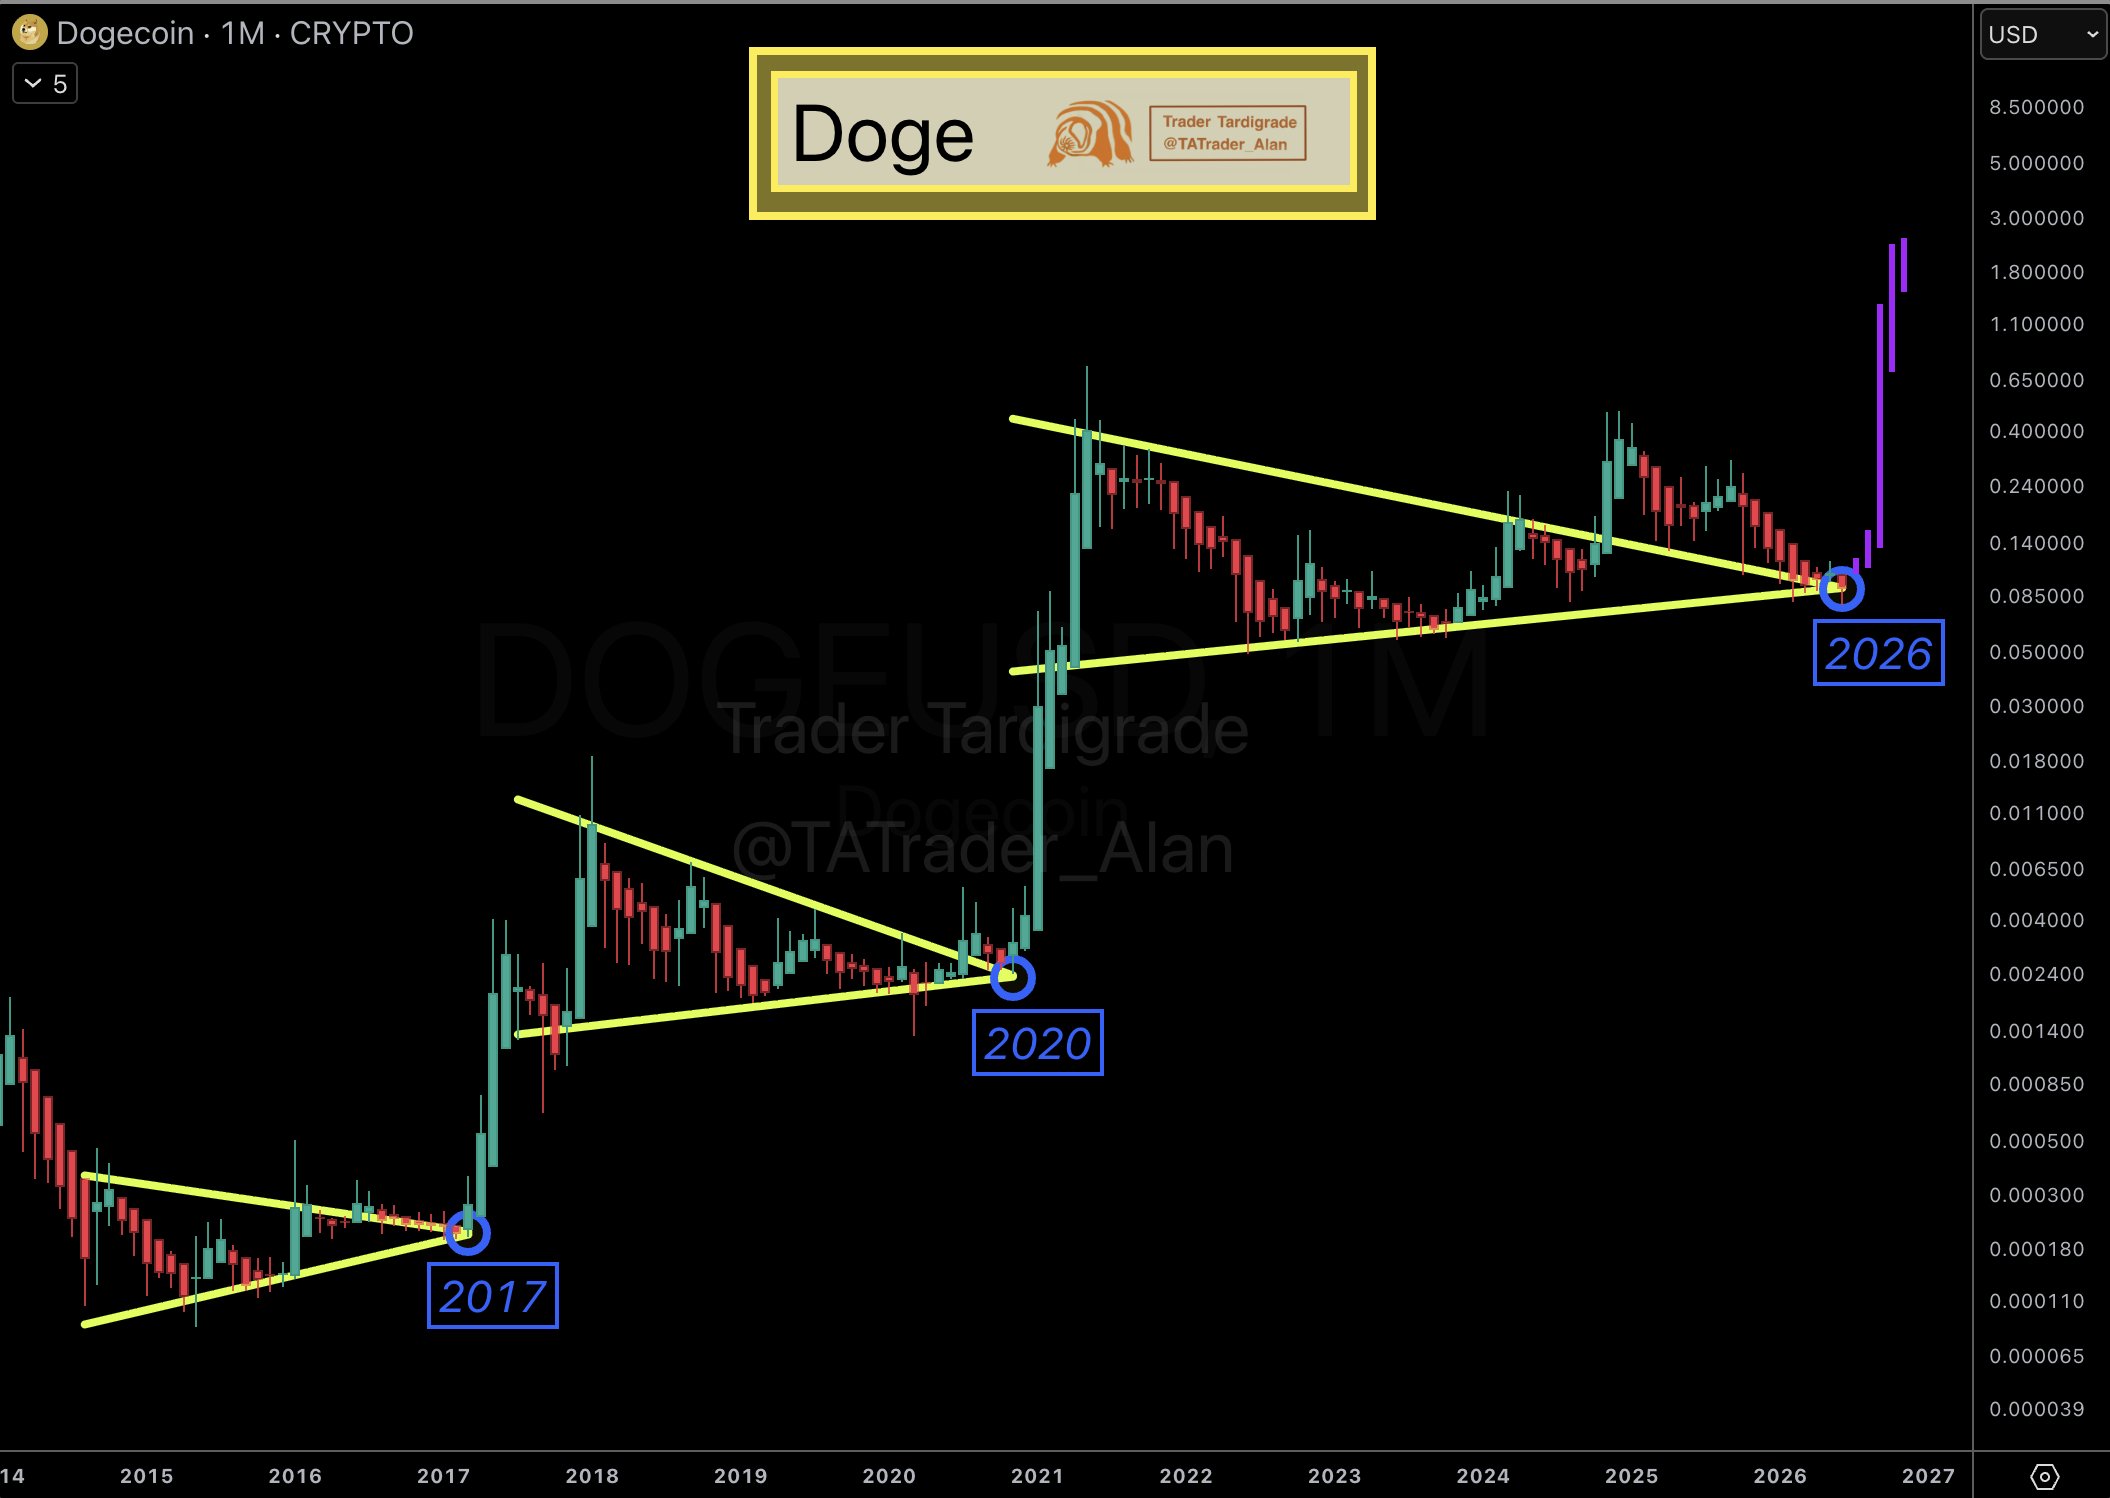
Trader Tardigrade highlighted this recurring triangle pattern visible on the monthly Heikin Ashi chart in a June 14 X post. According to him, this setup is notable because it resembles formations that emerged ahead of the 2017 and 2020 breakouts to unprecedented prices.
Dogecoin Repeats a Familiar Multi-Year Pattern
The analyst identified a clear pattern that Dogecoin ($DOGE) has followed several times now. A triangle compression starts, then a breakout and apex retest, before a parabolic expansion follows.
He further highlighted three different periods where Dogecoin spent years compressing inside a symmetrical triangle before eventually breaking out. The first formation developed between 2014 and early 2017, with the token breaking out from around $0.000208 in March 2017 to $0.0187 in January 2018.
The second stretched from the 2018 high before a breakout in July 2020. The full bullish rally started in November 2020, sending $DOGE from $0.0025 to its current all-time high of $0.74.
In both cases, prices gradually narrowed between rising support and falling resistance before reaching the triangle’s apex. Rather than immediately launching after the breakout, Dogecoin first revisited the breakout zone, testing it as support before beginning a much larger advance.
The latest cycle appears to be following a similar path. After breaking out in October 2024 to the peak of $0.484 in December 2024, Dogecoin entered a prolonged correction that pushed it back toward the convergence point of its multi-year triangle. The apex retest occurred following the drop to $0.077 two weeks ago.
This places the current price action near the same structural level that previously acted as support for major rallies.
Can History Repeat for Dogecoin?
Technical analysts often view an apex retest as a critical moment within a broader market cycle. When a former resistance structure is revisited and successfully defended, it can signal that sellers are losing control while longer-term buyers begin stepping back into the market.
The chart shows this behavior occurring in three separate cycles. In 2017, Dogecoin retested the apex area before beginning a sharp rally. A nearly identical sequence unfolded in 2020, with price returning to the breakout zone shortly before the well-known rally that followed.
Tardigrade suggests that if the historical pattern remains intact, Dogecoin could attempt another move toward higher resistance zones over the coming months. The chart shows a possible parabolic expansion towards the $3 mark, representing a staggering 3,310% increase from the current market price of $0.088.
However, confirmation remains important. Dogecoin still needs to hold above the retested support region and demonstrate renewed buying interest before any larger move can develop. Buying activity seems to be already picking up, with whales procuring 30 billion $DOGE in recent weeks.
Nonetheless, failure to maintain the retested area would weaken the comparison with prior cycles.

