


 8
8
$XRP traded near a critical technical zone as traders weighed fading bullish momentum against improving institutional developments surrounding Ripple’s expanding prime brokerage business. Although the token maintained its broader uptrend above key moving averages, price action slowed beneath major resistance after an aggressive rally from late-April lows.
$XRP Momentum Slows Below Key Resistance
The four-hour $XRP/USD chart still reflected a bullish market structure despite recent cooling momentum. $XRP climbed from the $1.38 region toward $1.49 during the latest impulse wave. However, buyers struggled to sustain strength near the upper resistance band.
Price continued trading above the 50, 100, and 200 exponential moving averages. Consequently, medium-term bullish control remained intact. The EMA alignment also reinforced positive trend conditions, with the 20 EMA positioned near $1.4496 and the 200 EMA near $1.4080.
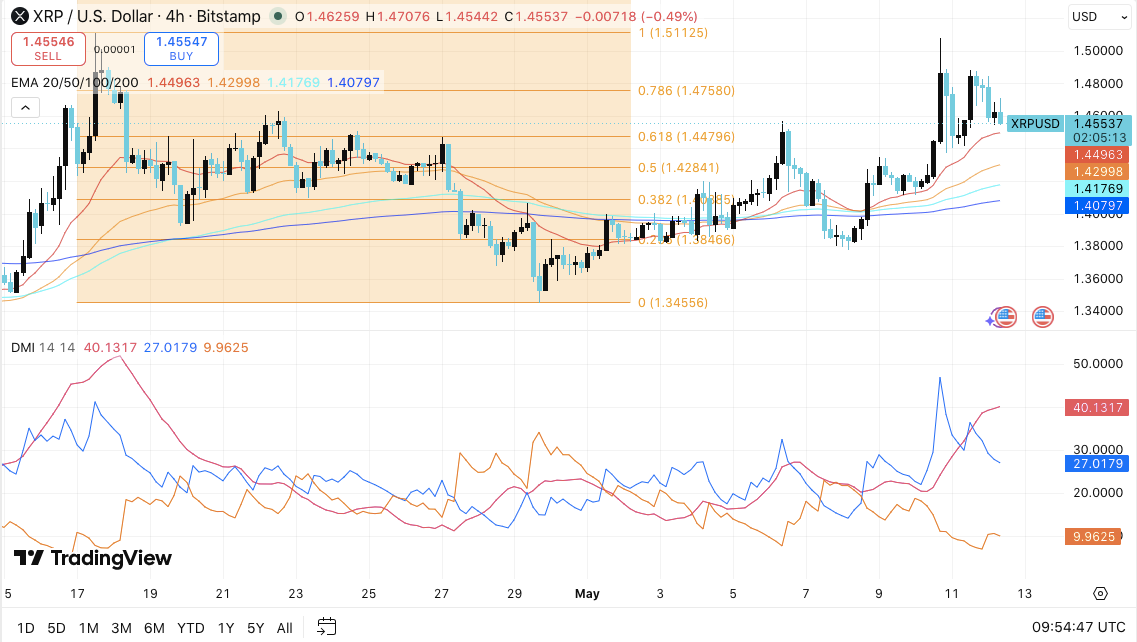
Traders closely monitored the Fibonacci retracement range between $1.448 and $1.428. This area combined the 0.618 retracement level with several moving average supports. Hence, bulls needed to defend this zone to maintain upward momentum.
The $1.475 to $1.490 region remained the immediate barrier. Sellers rejected $XRP twice inside that range during recent sessions. If buyers clear the $1.511 breakout level, analysts expect a stronger expansion toward $1.55 and potentially $1.60.
Related: BUILDon (B) Price Prediction: B Jumps 35% as Open Interest Surges Above $130 Million
However, momentum indicators showed early signs of exhaustion. The Directional Movement Index revealed weakening bullish pressure as the positive directional index declined.
Simultaneously, bearish pressure gradually increased while the ADX indicator stayed elevated. This setup often signals consolidation before the next decisive move.
Open Interest and Spot Flows Suggest Stabilization
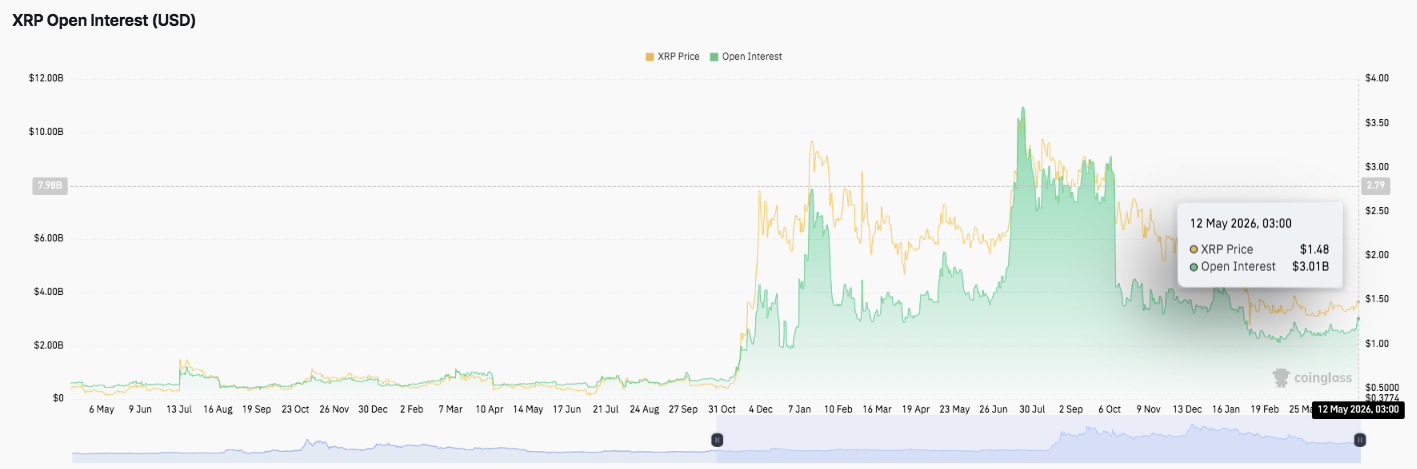
Derivatives activity also reflected more cautious participation after last year’s speculative surge. $XRP open interest remained subdued through much of early 2024 before accelerating sharply during late 2025 rallies. Open interest eventually climbed above $10 billion during $XRP’s multiyear highs.
Since then, leverage steadily declined across the market. By May 2026, open interest stabilized near $3.01 billion while $XRP traded around $1.48. Moreover, this stabilization suggested traders reduced excessive leverage while maintaining moderate exposure.
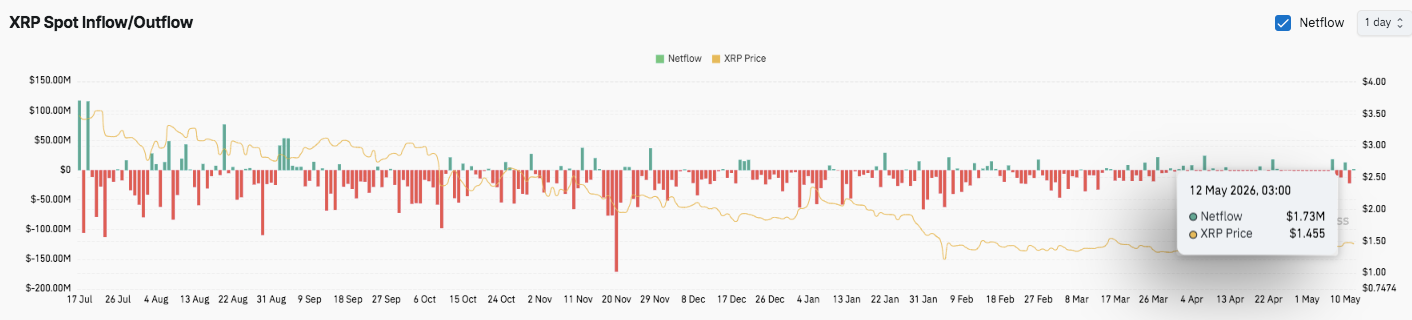
Spot flow data showed a similar pattern. Persistent outflows dominated between July and March as $XRP weakened from above $3.50 toward $1.50. Nevertheless, recent months showed smaller outflows alongside intermittent inflow bursts. Consequently, bearish pressure appeared to ease gradually.
Ripple Expands Institutional Financing Capacity
Beyond price action, Ripple announced a major financing agreement for Ripple Prime. The company secured a $200 million debt facility from Neuberger Specialty Finance to support institutional lending and margin expansion.
Ripple stated that Ripple Prime tripled annual revenue since the company acquired the platform in 2025. Additionally, rising institutional demand increased the need for scalable financing and reliable liquidity access.
Related: Cardano Price Prediction: Grayscale ADA ETF Expected by October as RWA Proposal Hits the Treasury
The facility gives Ripple Prime additional flexibility to support institutional clients across traditional and digital asset markets. Moreover, the agreement highlighted growing institutional confidence in Ripple’s expanding enterprise infrastructure.
Technical Outlook For $XRP Price
Key levels remain clearly defined as $XRP consolidates beneath a major breakout zone after its recent rally from the $1.38 region.
Upside levels: $1.475, $1.490, and $1.511 now stand as immediate resistance barriers. A confirmed breakout above $1.511 could open the path toward $1.55 and potentially $1.60 in an extended bullish continuation.
Downside levels: $1.448 remains the first key support, followed by $1.428 and the broader $1.408–$1.417 trend support cluster. A deeper breakdown below $1.384 would weaken the current bullish structure and expose $XRP to a retest of the $1.35 region.
Resistance ceiling: The $1.511 breakout level remains the critical zone to reclaim for sustained medium-term upside momentum. Bulls continue defending the EMA50 and EMA100 structure, which keeps the broader trend constructive despite cooling momentum indicators.
The technical picture suggests $XRP is entering a compression phase between $1.428 and $1.475 as volatility gradually tightens. DMI readings show bullish pressure weakening while bearish momentum slowly rises, signaling the market may require consolidation before the next directional expansion.
Will $XRP Go Up?
$XRP price prediction for the coming weeks depends heavily on whether buyers can continue defending the $1.448–$1.428 support band while building enough momentum to clear $1.475 and eventually $1.511.
If bullish momentum strengthens alongside improving inflows and rising participation, $XRP could accelerate toward $1.55 and $1.60. Additionally, stabilizing open interest near $3 billion suggests speculative excess has cooled, which may provide healthier conditions for a sustainable move higher.
Related: Pi Network Price Prediction: Smart Contracts Launch May 15 as 18.1M Pioneers Complete KYC
Failure to hold the $1.428 support zone, however, could trigger a deeper retracement toward $1.408, $1.384, and possibly $1.35.

