


 6
6
Bitcoin, the leading cryptocurrency by market cap, is trading around $80,700, down by less than 1% in the last 24 hours.
Meanwhile, Ether has dropped below $2,300 after losing 2% of its value since Monday.
$HYPE, the native coin of the Hyperliquid DEX, is also down by 1.5% and is now trading below $42, breaking below its rising trendline support.
The bearish narrative is supported by weakening derivatives metrics. Technical indicators also show early signs of weakness, suggesting a near-term correction.
Derivatives data support a bearish bias
$HYPE is down 1.5% and is now trading at $41. The bearish performance comes as retail traders reduce their exposure to the coin.
According to CoinGlass, Hyperliquid’s OI-Weighted Funding Rate data has flipped negative, reading -0.0008% on Tuesday, indicating shorts are paying longs and projecting a bearish sentiment.
Furthermore, the long-to-short ratio for $HYPE now stands at 0.81, its lowest level in over a month.
The ratio declining below one also indicates bearish sentiment in the market, as more traders are betting on the asset price to fall.
While the derivative data support a bearish sentiment, CryptoQuant’s summary data reflects a neutral to slightly bullish outlook for $HYPE.
According to CryptoQuant, the spot and futures markets for $HYPE show cooling conditions and buy-side dominance, with mostly neutral conditions across other metrics, supporting a potential recovery.
Hyperliquid price forecast: Sellers could push $HYPE below $40
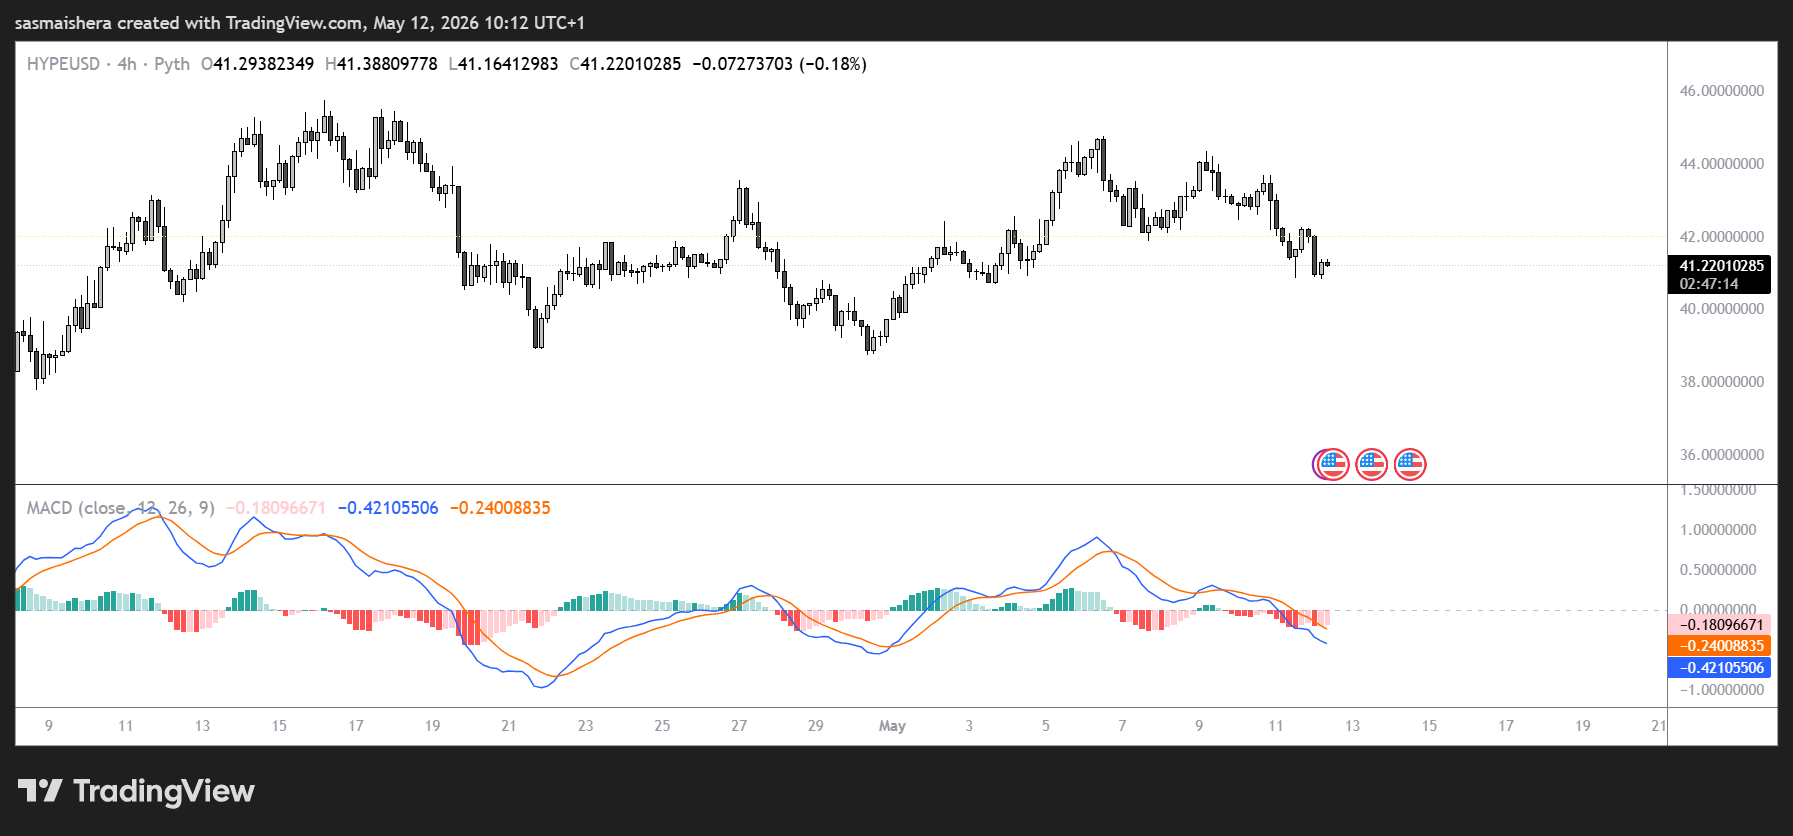
The $HYPE/USD 4-hour chart is bearish and efficient as Hyperliquid has underperformed over the past few days.
$HYPE’s price broke below the rising trendline a few hours ago and is now trading at $41, after correcting 2.35% the previous day.
If the bearish trend persists and the daily candle closes below this trend support, the sellers could push the price lower towards the 50-day Exponential Moving Average (EMA) at $40.30.
An extended bearish market condition could see $HYPE test the 100-day and 200-day EMA at $37.87 and $36.05, respectively, in the coming hours or days.
Momentum indicators are also flashing early signs of weakness. The Relative Strength Index (RSI) on the 4-hour chart reads 43, slipping below the neutral level.
Meanwhile, the Moving Average Convergence Divergence (MACD) indicators on the same chart showed a bearish crossover on Monday, projecting a negative outlook.
However, if the bulls regain control in the near term, $HYPE could extend the advance toward the April 16 high of $45.76.
The ongoing talks between the United States and Iran continue to affect the cryptocurrency market.
A peaceful resolution between the two parties could see Bitcoin, $HYPE, and other major cryptocurrencies rally in the near term.
