

 1
1
Ripple ($XRP) scales downward, trading at $1.45 at the time of writing on Tuesday. $XRP is currently trading about 3% below its weekly open at $1.47 and approximately 4% below its monthly high of $1.51, highlighting mounting overhead resistance.
$XRP demand holds firm across retail and institutions
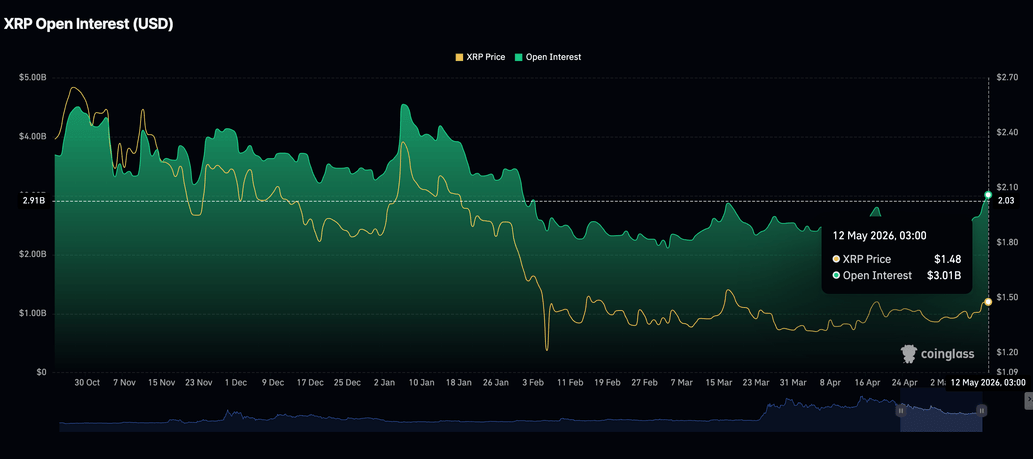
The $XRP derivatives market continues to steadily increase, with futures Open Interest (OI) reaching a three-month high of $3.01 billion on Tuesday, up from $2.87 billion the previous day.
OI has climbed 30% from its yearly low of $2.11 billion recorded in early March. Further gains would solidify retail investor dominance and bolster the probability of a sustained recovery as risk appetite grows.
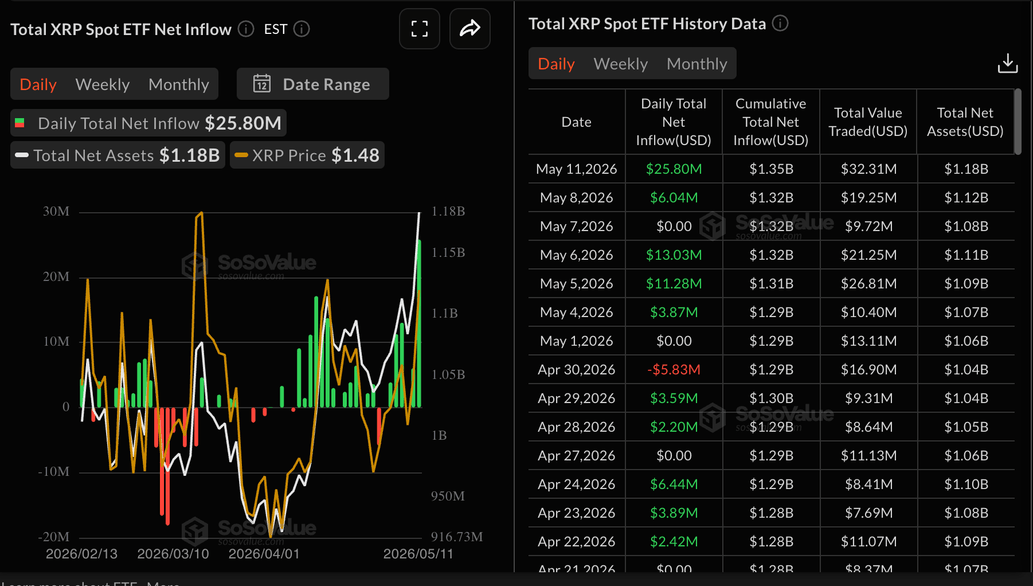
US-listed $XRP spot Exchange-Traded Funds (ETFs) have also gained traction since Friday, with inflows nearing $26 million on Monday. Cumulative inflows stand at $1.35 billion, with net assets under management averaging $1.18 billion, according to SoSoValue.
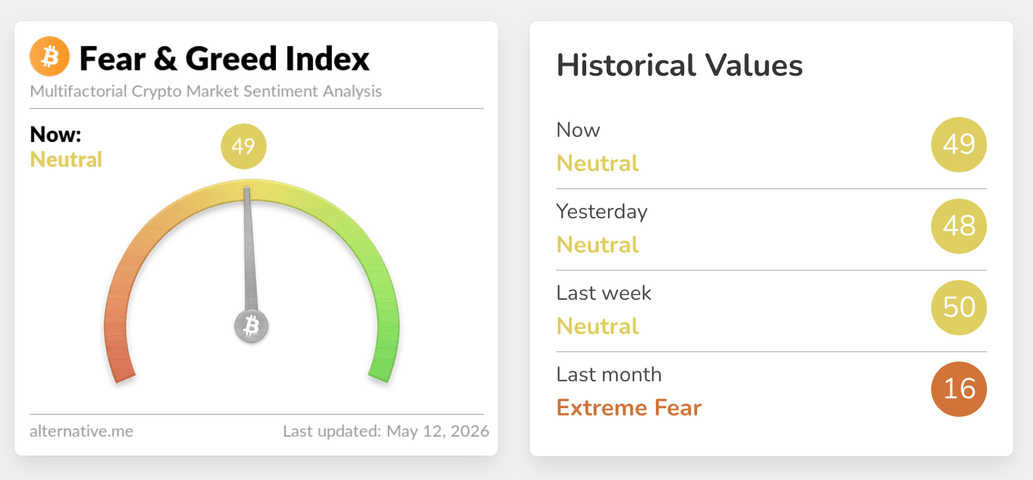
The surge in institutional and retail interest aligns with steady market sentiment, as reflected by the Crypto Fear & Greed Index rising to 49 in the fear territory on Tuesday, up from 48 the previous day.
Technical outlook: $XRP extends correction as technical weakness builds
$XRP trades at $1.45, holding above the 50-day Exponential Moving Average (EMA) at $1.42 and the latest SuperTrend support at $1.33, hinting at a mildly constructive tone. Still, the broader structure remains capped, as price remains below the 100-day EMA at $1.50 and well below the 200-day EMA at $1.71.
On the daily chart, the Moving Average Convergence Divergence (MACD) histogram is marginally positive and rising, while the Relative Strength Index (RSI) hovers near 57, suggesting improving but not yet overextended upside momentum within this still medium-term constrained backdrop.
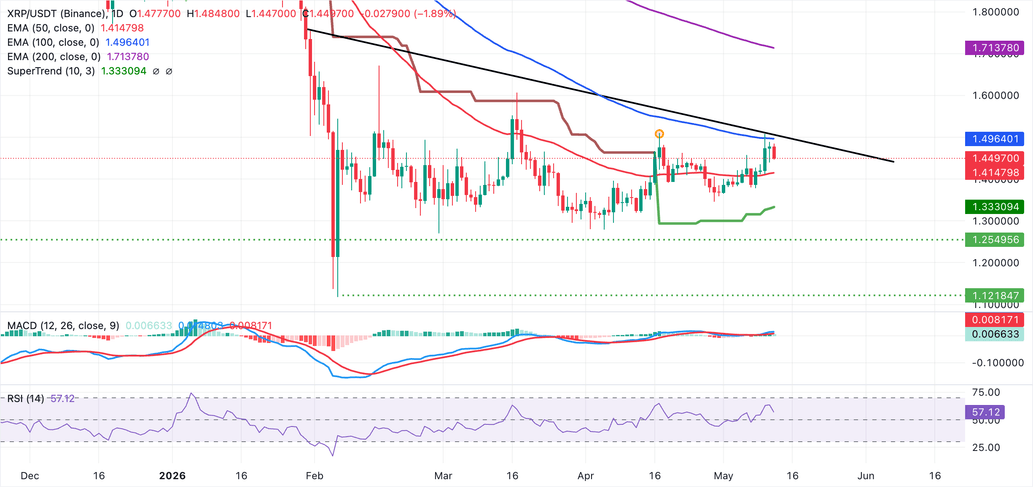
On the topside, initial resistance is seen at the 100-day EMA around $1.50, with a downward resistance trendline at a similar level. A daily close above this confluence would open the way toward the higher barrier at the 200-day EMA around 1.71. On the downside, immediate support is aligned with the daily low at $1.44, followed by firmer demand at the 50-day EMA at $1.41. A break below that demand cluster would expose the next SuperTrend support region near $1.33.
(The technical analysis of this story was written with the help of an AI tool.)
