

 5
5
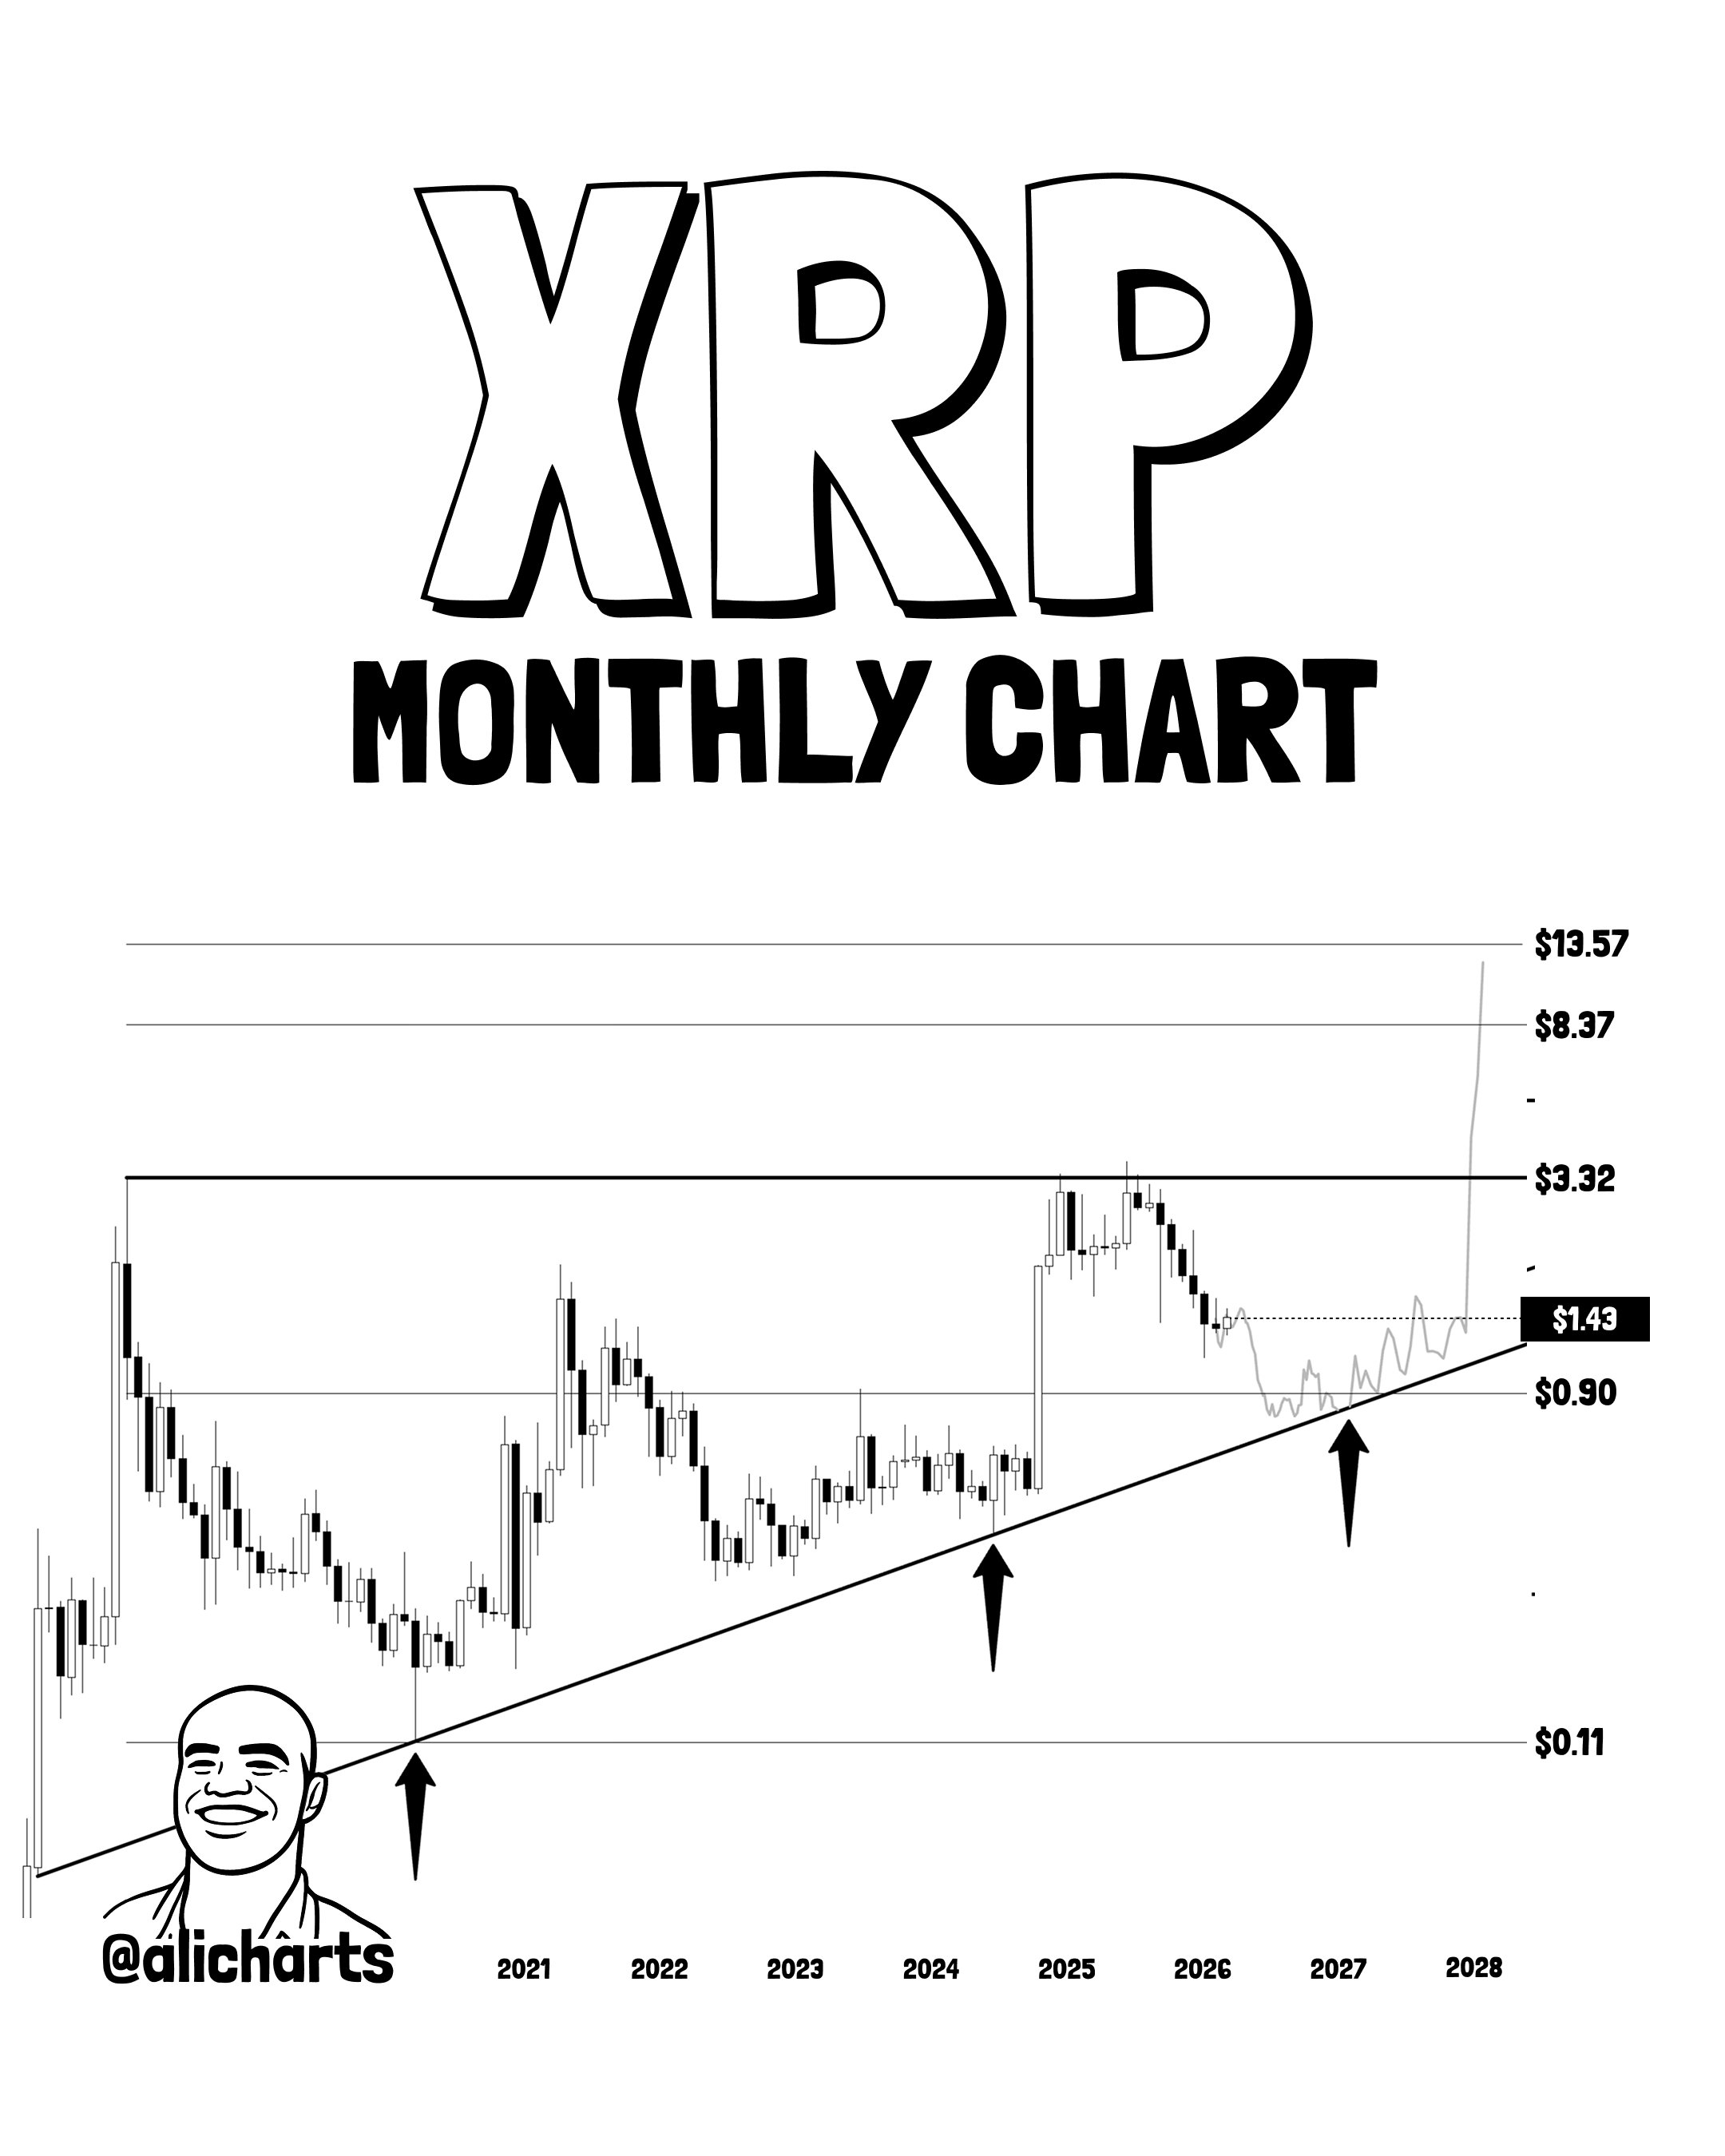
Analyst Ali Martinez has pointed to a long-term structure forming on $XRP monthly chart, suggesting the asset could be preparing for a double-digit price run.
The bullish outlook comes as $XRP continues to hold around $1.42, losing over 1.1% of its earlier gains.
Key Points
- $XRP could target $13, as a multi-year ascending triangle signals strong long-term breakout potential.
- Analyst Ali Martinez identifies $0.90 as a key bear market floor before any sustained rally begins.
- Short-term downside risk remains, with $XRP dropping before building momentum for a larger move.
- Rare “Bull Switch” signal reappears, which has historically led to major rallies in 2017, 2021, and 2025.
Road to $13 $XRP
According to Martinez, $XRP has been trading within a massive ascending triangle that has developed over several years. This pattern shows a rising support trendline and a strong resistance zone near previous highs.
Based on this structure, he identifies a bear market bottom under $1, where the price could find strong support before any major move higher.
On the upside, the same formation projects a long-term breakout target of around $13. From today’s price, $XRP holders are looking at a price surge of over 9x.
Short-Term Risk Before a Bigger Move
Despite the bullish long-term outlook, the analysis suggests $XRP may still face near-term downside pressure. Specifically, Martinez stated that $XRP’s price could drop toward the $0.90 zone before any sustained rally begins. He considers this level a potential bottom for the next upward wave.
At the time of analysis, $XRP is trading around $1.43, with a 5% gain over the past month. While the $2 and $3.32 regions remain key barriers, Martinez’s chart shows that a strong momentum may easily overcome these resistance levels and establish a new peak in the double-digit range.
 Commenting on the analysis, popular $XRP market watcher ChartNerd approved it, saying it makes logical sense for $XRP’s path. He has repeatedly argued that $XRP’s price could fall to the $0.70–$1 range before the next major leg up.
Other Technical Patterns Calling for $10+ $XRP
Meanwhile, in a recent separate statement, ChartNerd highlighted additional technical structures that make a bullish case for $XRP’s price.
Specifically, he said a rare $XRP signal called the “Bull Switch” has reappeared. He noted that it has only shown up three times in 13 years, each followed by a major rally in 2017, 2021, and 2025.
The pattern typically marks a shift from bearish to bullish momentum after long consolidation phases. With $XRP recently recovering from a drop between $3.66 and $1.11, the signal suggests a possible new uptrend. It indicates that $XRP may be preparing for another breakout.
However, unlike Martinez, ChartNerd did not provide a short-term price target for $XRP based on this technical observation.
In another analysis, EGRAG argued that $XRP remains within its long-term “Bifrost Bridge” channel dating back to 2014, keeping the broader uptrend intact despite recent declines. He insists $XRP can reach a $13 target, which aligns with Martinez’s projection.