

 3
3
The cryptocurrency market opened the new week bullish, with Bitcoin racing above $79,200, while Ether approached $2,400.
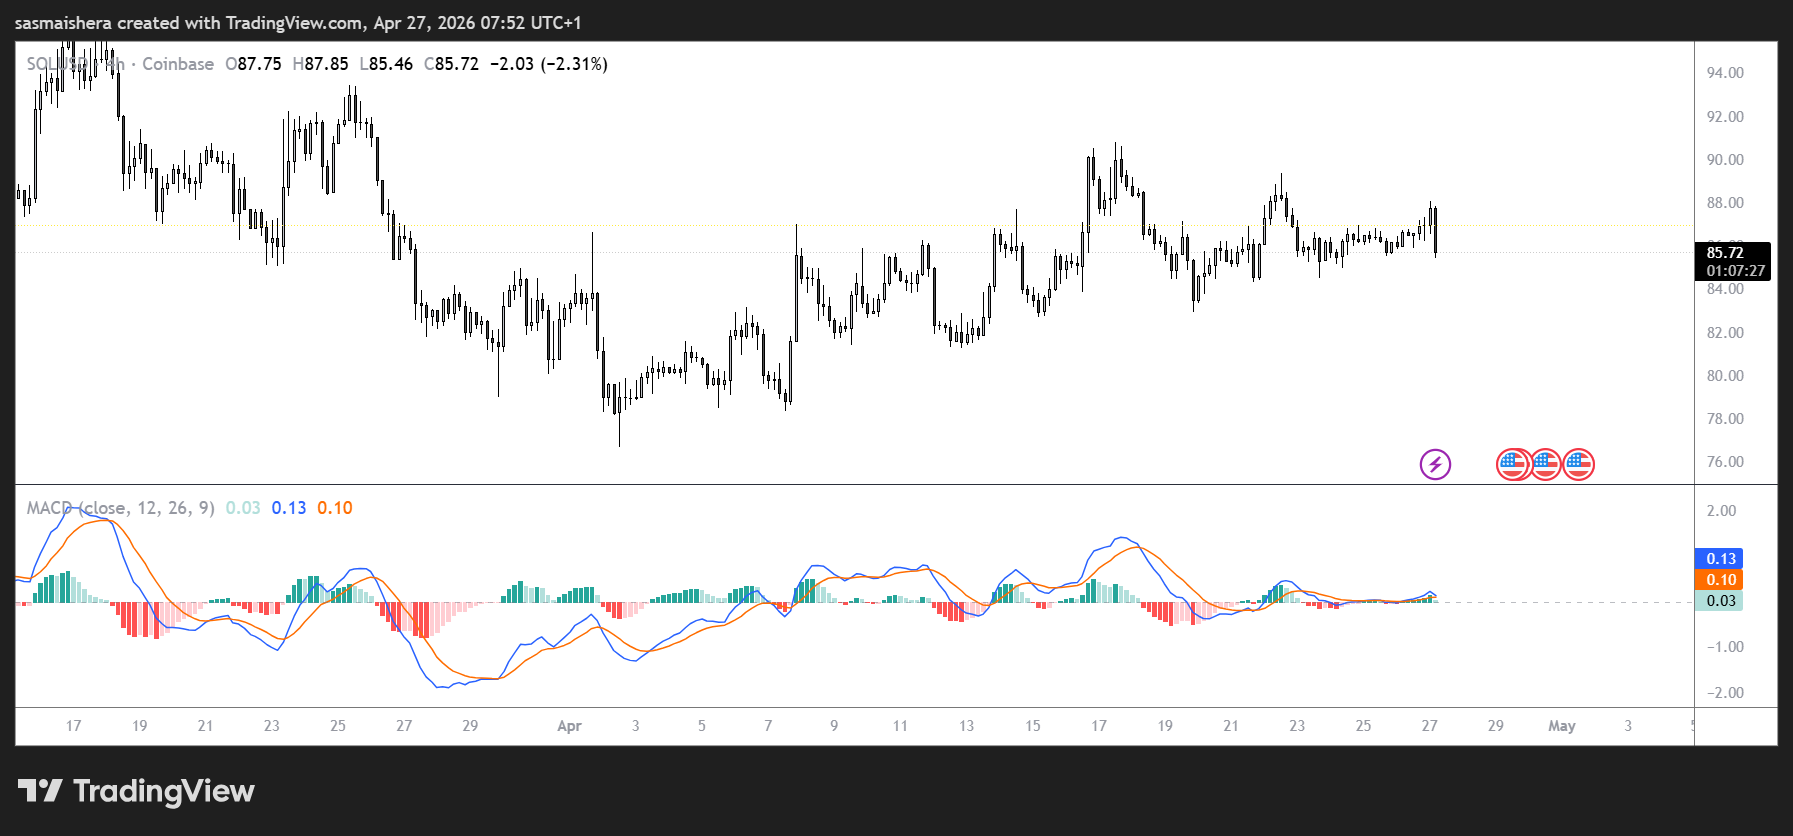
However, the market has slightly retraced, with Bitcoin now trading below $78,000. Solana’s $SOL also hit the $88 mark during the early hours of Monday, but has now dropped to trade at $85.
The bulls could push the price higher in the near term, thanks to renewed weekly inflows in $SOL-focused Exchange Traded Funds (ETFs) and rising activity in Solana futures.
The technical outlook for Solana is cautiously optimistic, as a short-term recovery could test a triangle breakout.
$SOL’s institutional and retail demand continues to rise
The market has retraced following the recent rally, but the bullish trend could resume soon thanks to positive data from the Solana ecosystem.
According to CoinGlass’s ETF page, Solana ETFs recorded $1.2 million in outflows on Friday, limiting the weekly inflow to $9.4 million following the previous week’s $35.2 million inflow.
The renewed weekly inflows into $SOL ETFs suggest that institutions are backing Solana once again, which could trigger an upside.
The demand is not limited to institutions. Retail traders are also increasing their exposure to Solana, as seen by the rising derivatives positions.
CoinGlass data shows that $SOL futures Open Interest (OI) is up over 2% in the last 24 hours, reaching $5.2 billion. This signals a positional buildup amid surging trader activity.
A spike in the funding rate to 0.0095% indicates a bullish buildup, as buyers are willing to hold long positions at a premium.
With the retail and institutional demand returning, Solana’s price could rally higher in the near to medium term.
Technical outlook: Is Solana ready to surpass $91 swing high?
The $91 swing high has served as a strong resistance level for Solana in recent weeks, with buyers struggling to push above this level.
However, the $SOL/USD 4-hour chart has flipped bullish, and this could allow Solana to rally higher in the near term.
$SOL is currently trading below the 50-day EMA at $87.04 but could resume its recovery if the daily candle closes above this level.
Momentum indicators back this positive tilt, with the Relative Strength Index (RSI) at 51, rising above its midline on the 4-hour chart.
Furthermore, the Moving Average Convergence Divergence (MACD) and its signal line rise into positive territory, hinting that buyers retain control while upside progress begins to confront nearby trend resistance.
If the bullish trend resumes, initial resistance would be encountered at the downward-sloping trendline, with a break level around $89.00.
A daily candle close above this barrier would expose the $100 psychological level, followed by the 200-day EMA at $113.
However, the 4-hour swing high at $91 could also face pushback from sellers.
However, if the sellers persist, immediate support is provided by the 50-day EMA at $87.04, with the rising trendline near $85.99 as the next line of defense.
A convincing break below this level would weaken the current bullish structure and suggest a deeper corrective phase.
