Momentum signals are also holding up. The Relative Strength Index (RSI) is sitting at 69, near overbought levels but still pointing to continued interest from bulls. A recent bullish cross in the moving averages supports the possibility of more upside in the near term. These signs reflect strength rather than exhaustion at this stage.
- Miners are slowly shifting coins to exchanges, hinting at nerves over more downside moves.
- The price still holds within a bullish chart setup, but a clean break above $105K is needed for a lift.
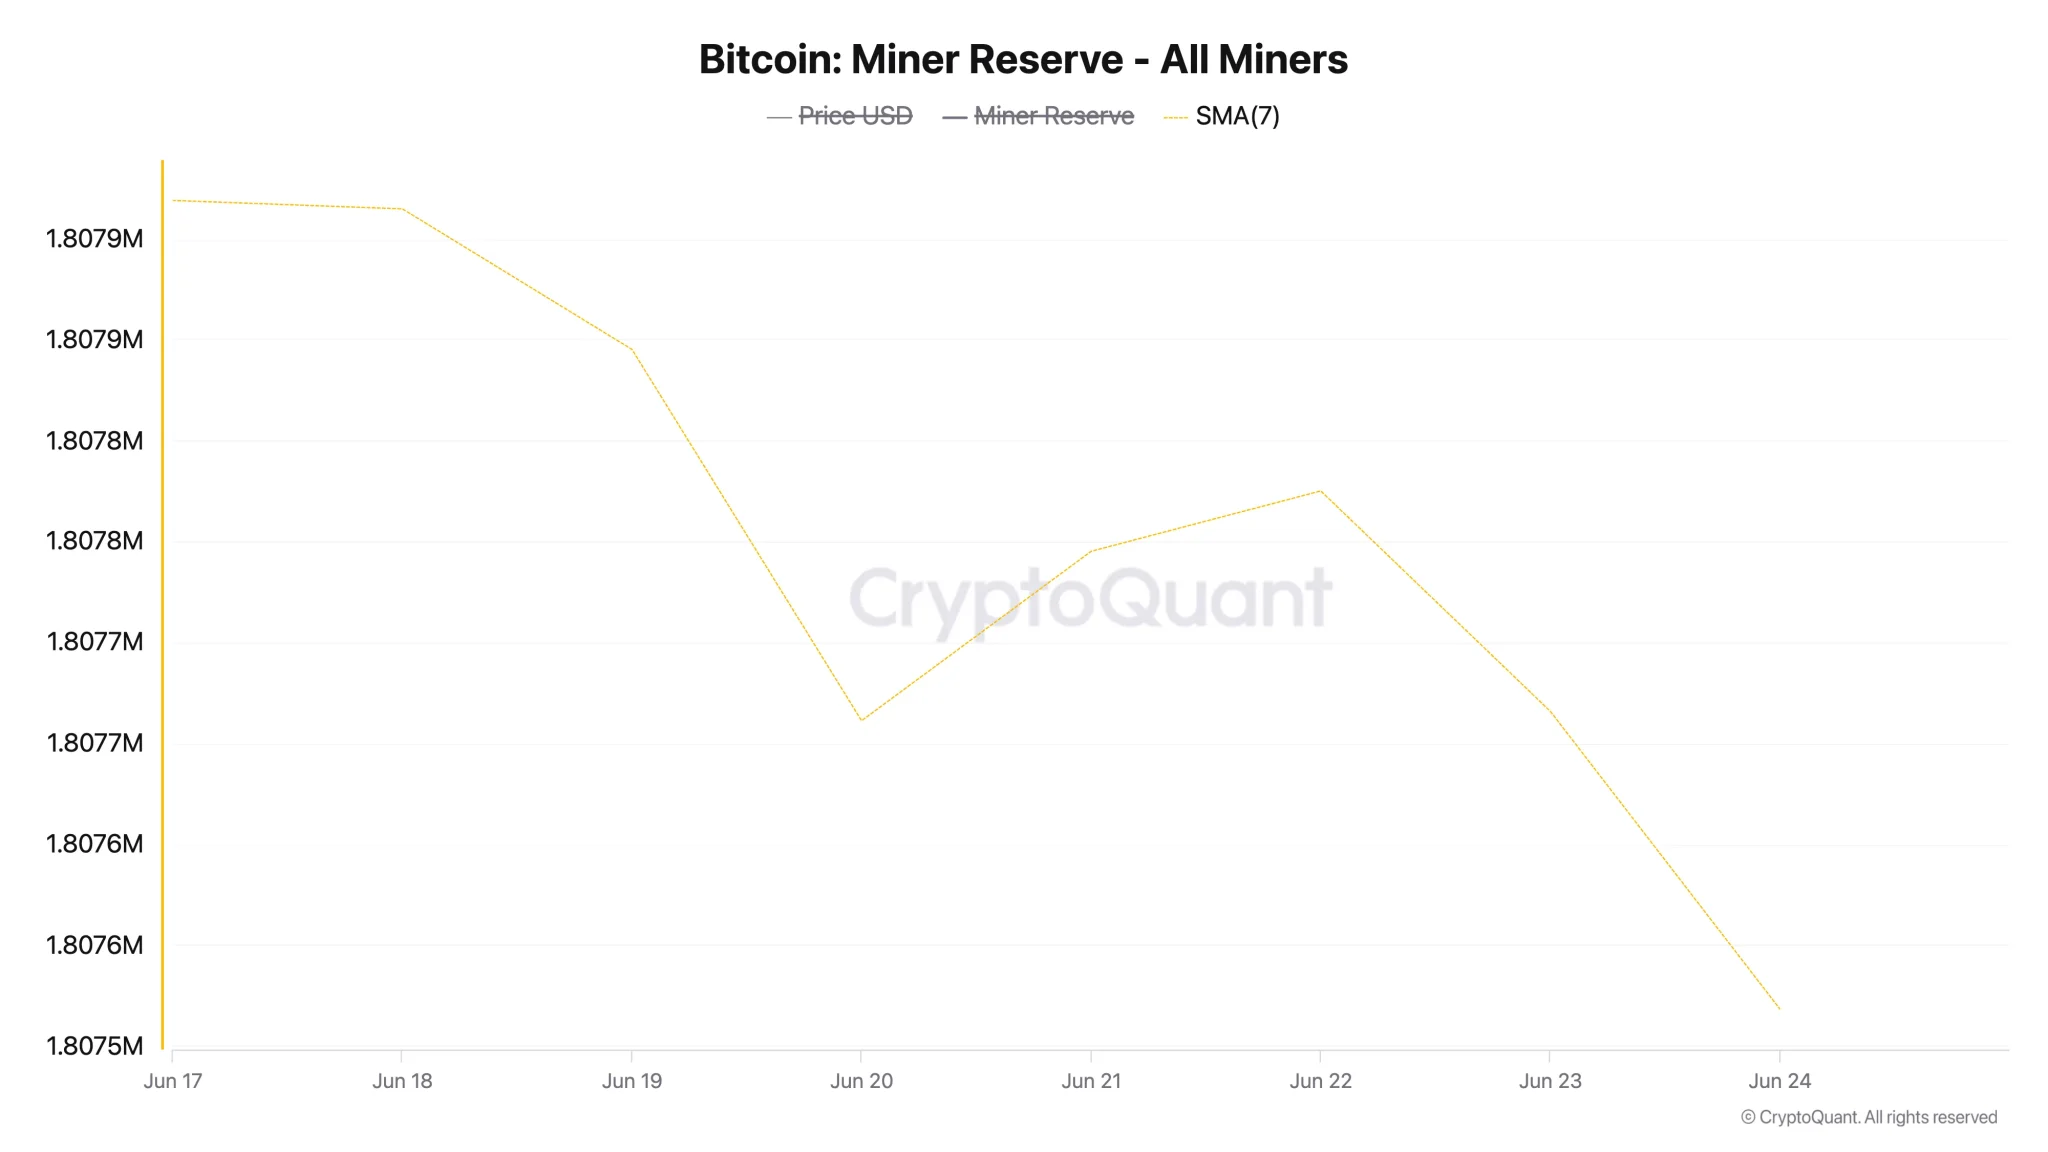
Bitcoin miners appear to be showing restraint, trimming their exposure and possibly bracing for broader market weakness. The miner reserve, which tracks how much Bitcoin miners are holding, dropped slightly by 0.022% over the past week on a 7-day average. Though small, this change suggests that some miners are leaning toward selling.
This shift points to declining confidence, especially after Bitcoin dipped below the $100,000 level during the last two trading sessions. That price has served as a psychological line for many, and falling through it may signal growing uncertainty across the market.
Adding weight to this sentiment is the sharp 55% spike in the Miners’ Position Index (MPI) within three days. This metric compares the volume of Bitcoin miners send to exchanges against their one-year average. A rising MPI generally means that miners are moving more of their holdings to exchanges, typically a sign that they intend to sell.
Market Tension Mounts as Bitcoin Miners Back Away
The recent trend in the MPI suggests increased selling activity, signaling that miners are becoming less confident in Bitcoin’s short-term performance. The shift of coins from wallets to exchanges indicates a belief that prices may drop further or fail to gain upward traction for now.
However, some analysts hold a different view. CryptooELITES expressed firm optimism, saying,
If you think a rally isn’t coming for Bitcoin, then you probably don’t know anything at all.
Another market watcher, Analyst Jelle, believes that Bitcoin remains in a bullish pennant pattern. He stated that initial breakouts from this type of setup are often deceptive. According to him, once the price reclaims strength and breaks above $110,000, “this flies a lot higher.”
#Bitcoin is back in the bullish pennant!
Usually with these patterns, the first breakout is a fake – and when price reverses, the true breakout is just around the corner.
Break above $110k and this flies a lot higher.
Let's see 👀 pic.twitter.com/TiSlKCUR8i
— Jelle (@CryptoJelleNL) June 24, 2025
Cup-and-Handle Targets $144K—Key Breakout Near
Bitcoin is currently showing a cup-and-handle pattern on the daily chart, a setup that traders often associate with a possible upward move. The price is trading within the handle portion, with resistance sitting at $105,000. This level also aligns with the 50-day simple moving average. A close above it would open the way to $109,000, which represents the neckline of the pattern.
Breaking $109,000 with strong volume could open the path to retesting the May 23 high of $112,000. If Bitcoin closes above that, traders would start watching for the full target of the cup pattern at $144,000—a level roughly 37% above current prices.