

 5
5
US households now have a larger share of their net worth tied to the stock market than at any point in modern history.
The figure stands at 25.63% of total household net worth, eclipsing the Dot-Com Bubble high of 19.56% and the 1968 peak of 22.01%.
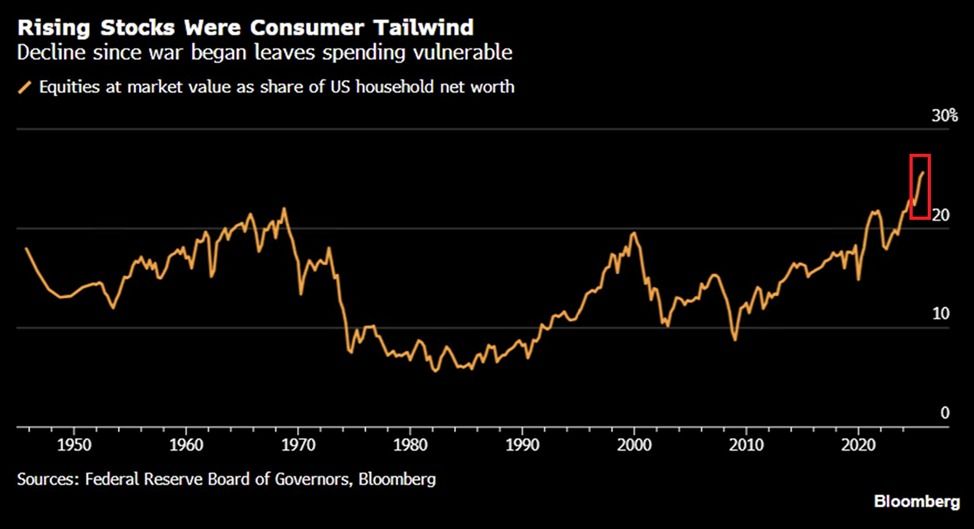
The share of equities in household wealth has nearly tripled since the 2008 Financial Crisis low of 8.77%. Measured as a share of financial assets, FRED’s Q4 2025 reading puts the figure at 47.1%.
But why is this concerning? All major US indices have trended lower in 2026. The Nasdaq Composite leads losses, declining 5.84% year to date.
Follow us on X to get the latest news as it happens
The S&P 500 is down 4.0%, the Russell 1000 has dropped 3.93%, and the Dow Jones Industrial Average has declined by 3.24%.
The sell-off is further fueled by the conflict between the US, Israel, and Iran, which has disrupted energy markets and shaken investor confidence.
With the record exposure, these declines aren’t just a portfolio problem. They’re an economic one. Consumer expenditures currently represent roughly 69% of US GDP.
“A significant correction in stocks could trigger a sharp pullback in spending, particularly among higher-income households who drive a significant part of consumption,” The Kobeissi Letter wrote.
Goldman Sachs also echoed this concern in a note, estimating that a 10% stock drop in equity prices sustained through the second quarter could shave 0.5 percentage points off GDP growth.
Thus, with equity exposure at a record, a correction would carry outsized consequences. Whether this cycle resolves through a soft landing or a harder repricing may depend on how long the geopolitical turmoil continues to weigh on markets.