



 2
2
At the time of writing, CoinGecko priced Ethereum at roughly $2,681, with the flagship altcoin down 0.3% over the past 24 hours but up 8.8% over seven days.
Ethereum has traded mainly between $2,635 and $2,700 during the latest session after reaching a recent high near $2,786.
$ETH's sideways move follows a rally from under $2,400 last week.
Buyers pushed the token through $2,500 and $2,600 before selling picked up between $2,700 and $2,800, leaving $ETH unable to hold its brief moves towards the upper end of that zone.
US spot Ethereum exchange-traded funds recorded $66.1 million in net inflows on September 24, extending their positive run to five consecutive sessions.
Combined inflows over the period reached roughly $746.5 million, helping support $ETH as buyers repeatedly stepped in around $2,625 to $2,650 even as the token struggled to clear $2,700.
Institutional buying has extended beyond ETFs, with Bitmine's Ethereum holdings reaching nearly 5.98 million $ETH this week after the company acquired another 27,562 $ETH.
The purchases have come while $ETH has held most of its recent gains, with the token still up more than 8% over seven days despite its rejection near $2,800.
$ETH's retreat from $2,786 has also cleared some leveraged long positions from the market.
According to CoinGlass, $43.1 million in Ethereum futures positions were liquidated on September 24, with long positions accounting for $28.1 million.
That followed $72.8 million in liquidations during the previous session, when longs made up nearly 84% of the total, pointing to continued pressure on leveraged bullish positions during $ETH’s pullback.
Higher US Treasury yields have coincided with $ETH's failure to extend its rally above $2,800.
The 10 year yield reached roughly 5.15% on Thursday as $ETH slipped back towards the mid $2,600s after touching $2,786.
Price action has consequently narrowed between buyers around $2,625 to $2,650 and sellers closer to $2,700 to $2,800.
A break from either side would determine whether $ETH resumes its September rally or returns towards the support levels formed earlier this month.
$ETH price analysis
Ethereum's daily chart still holds a bullish structure despite the rejection near $2,800.
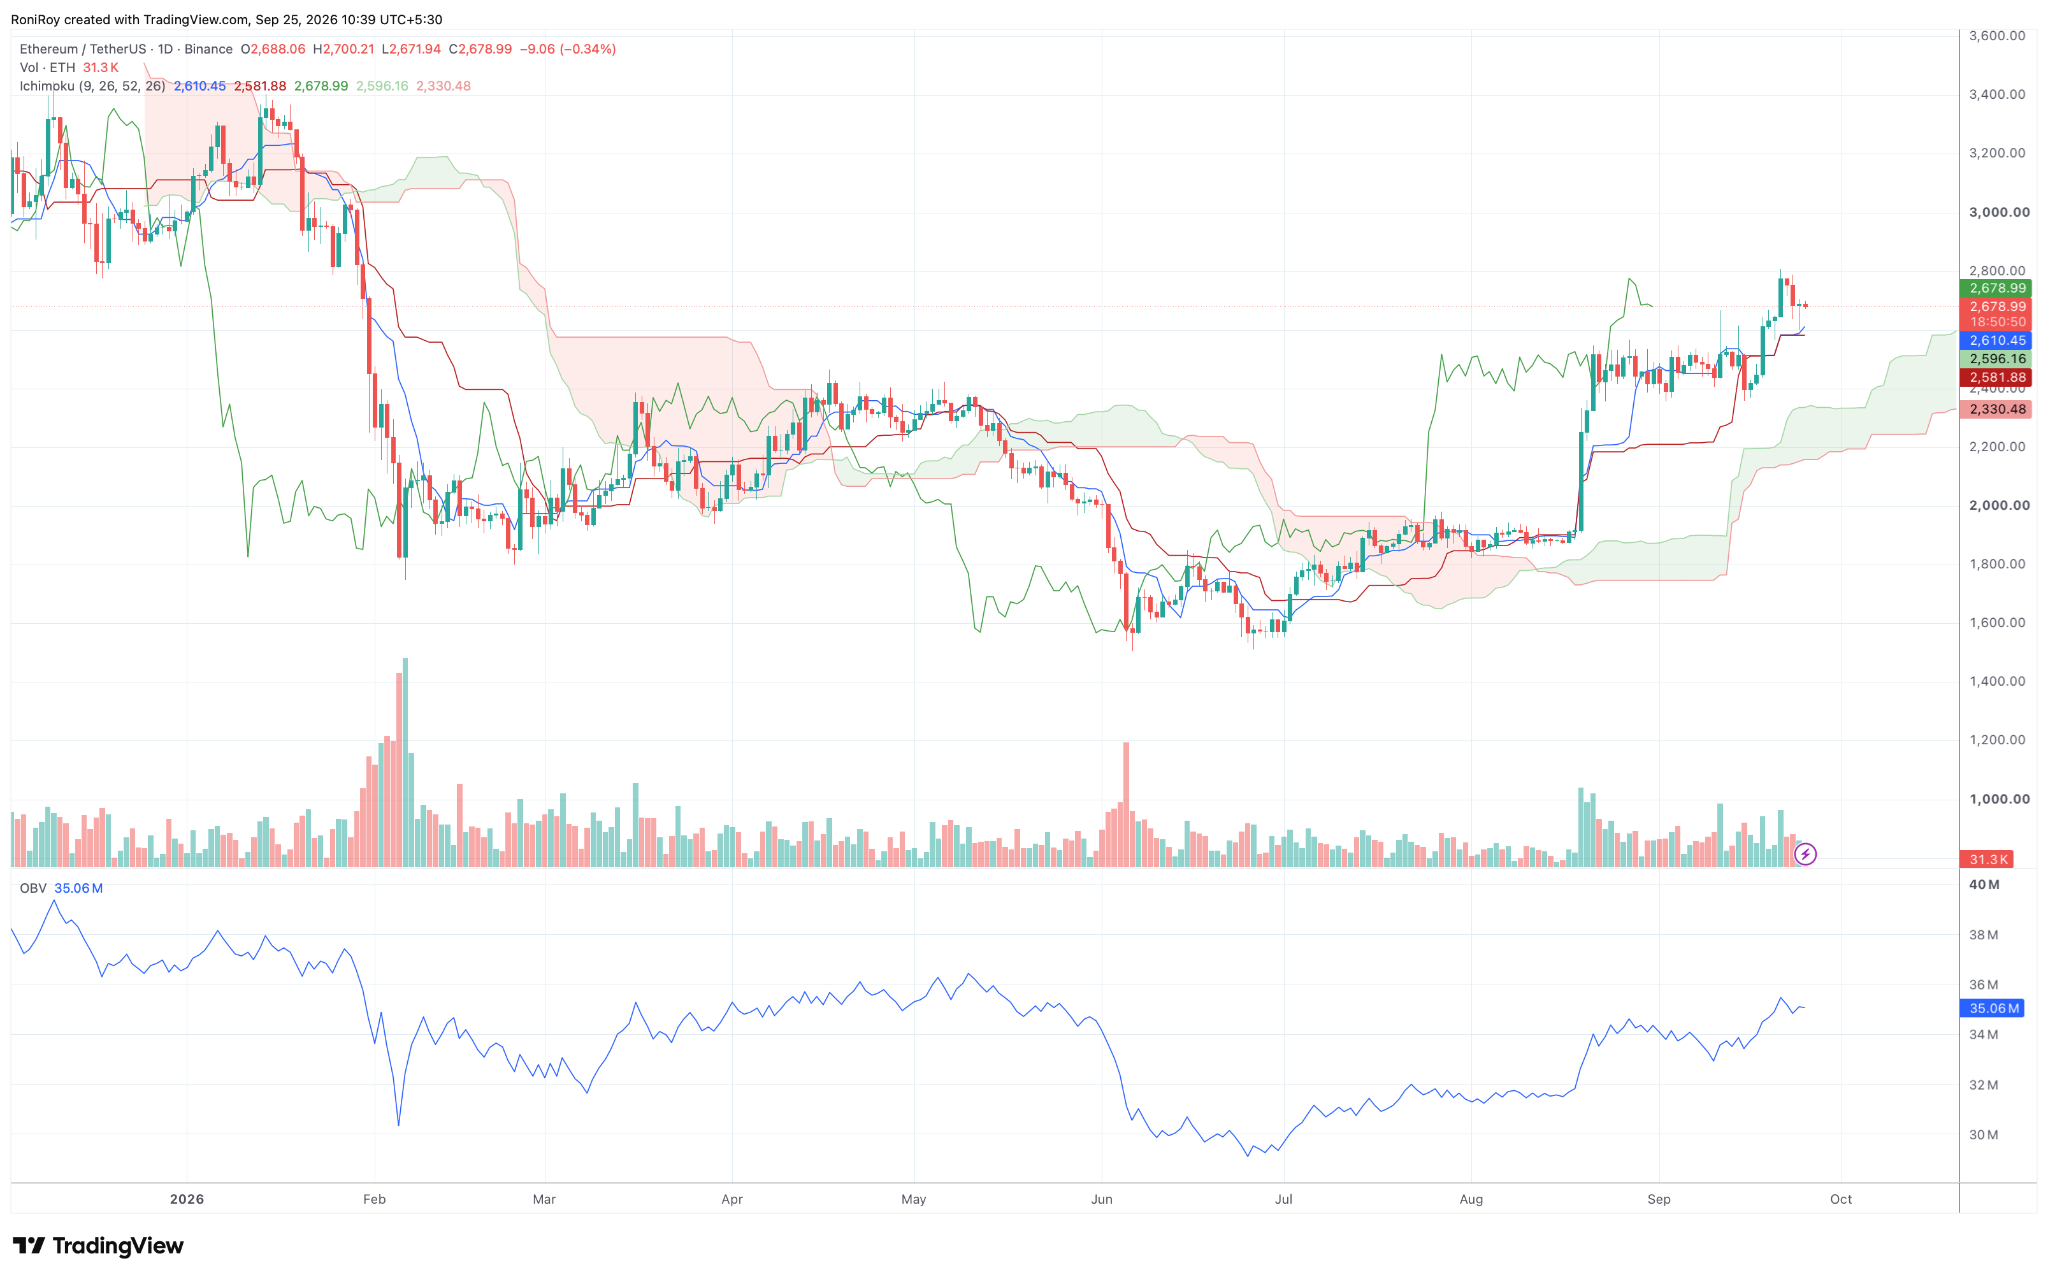
$ETH trades near $2,679 and remains above the Ichimoku cloud, while the Tenkan sen sits near $2,610 and the Kijun sen near $2,582. See below.
$ETH/$USDT 1-day price chart. Source: TradingView.
The Tenkan sen above the Kijun sen supports the current uptrend, and both lines now provide reference points if $ETH loses the $2,625 area.
A daily close below $2,610 would bring $2,582 into focus, while a break below the Kijun sen could open a move towards the $2,550 to $2,500 region.
The forward Ichimoku cloud remains green, with its upper boundary near $2,596.
Price therefore remains above the main trend support even after pulling back from $2,786.
Losing the cloud around $2,600 to $2,580 would weaken the structure that has developed since $ETH moved above $2,000 in August.
On balance, volume has climbed to 35.06 million alongside the September rally.
OBV moved higher as $ETH broke out of its August range and has remained close to its recent high during the latest consolidation, showing that the pullback from $2,800 has not yet been accompanied by a comparable fall in cumulative volume.
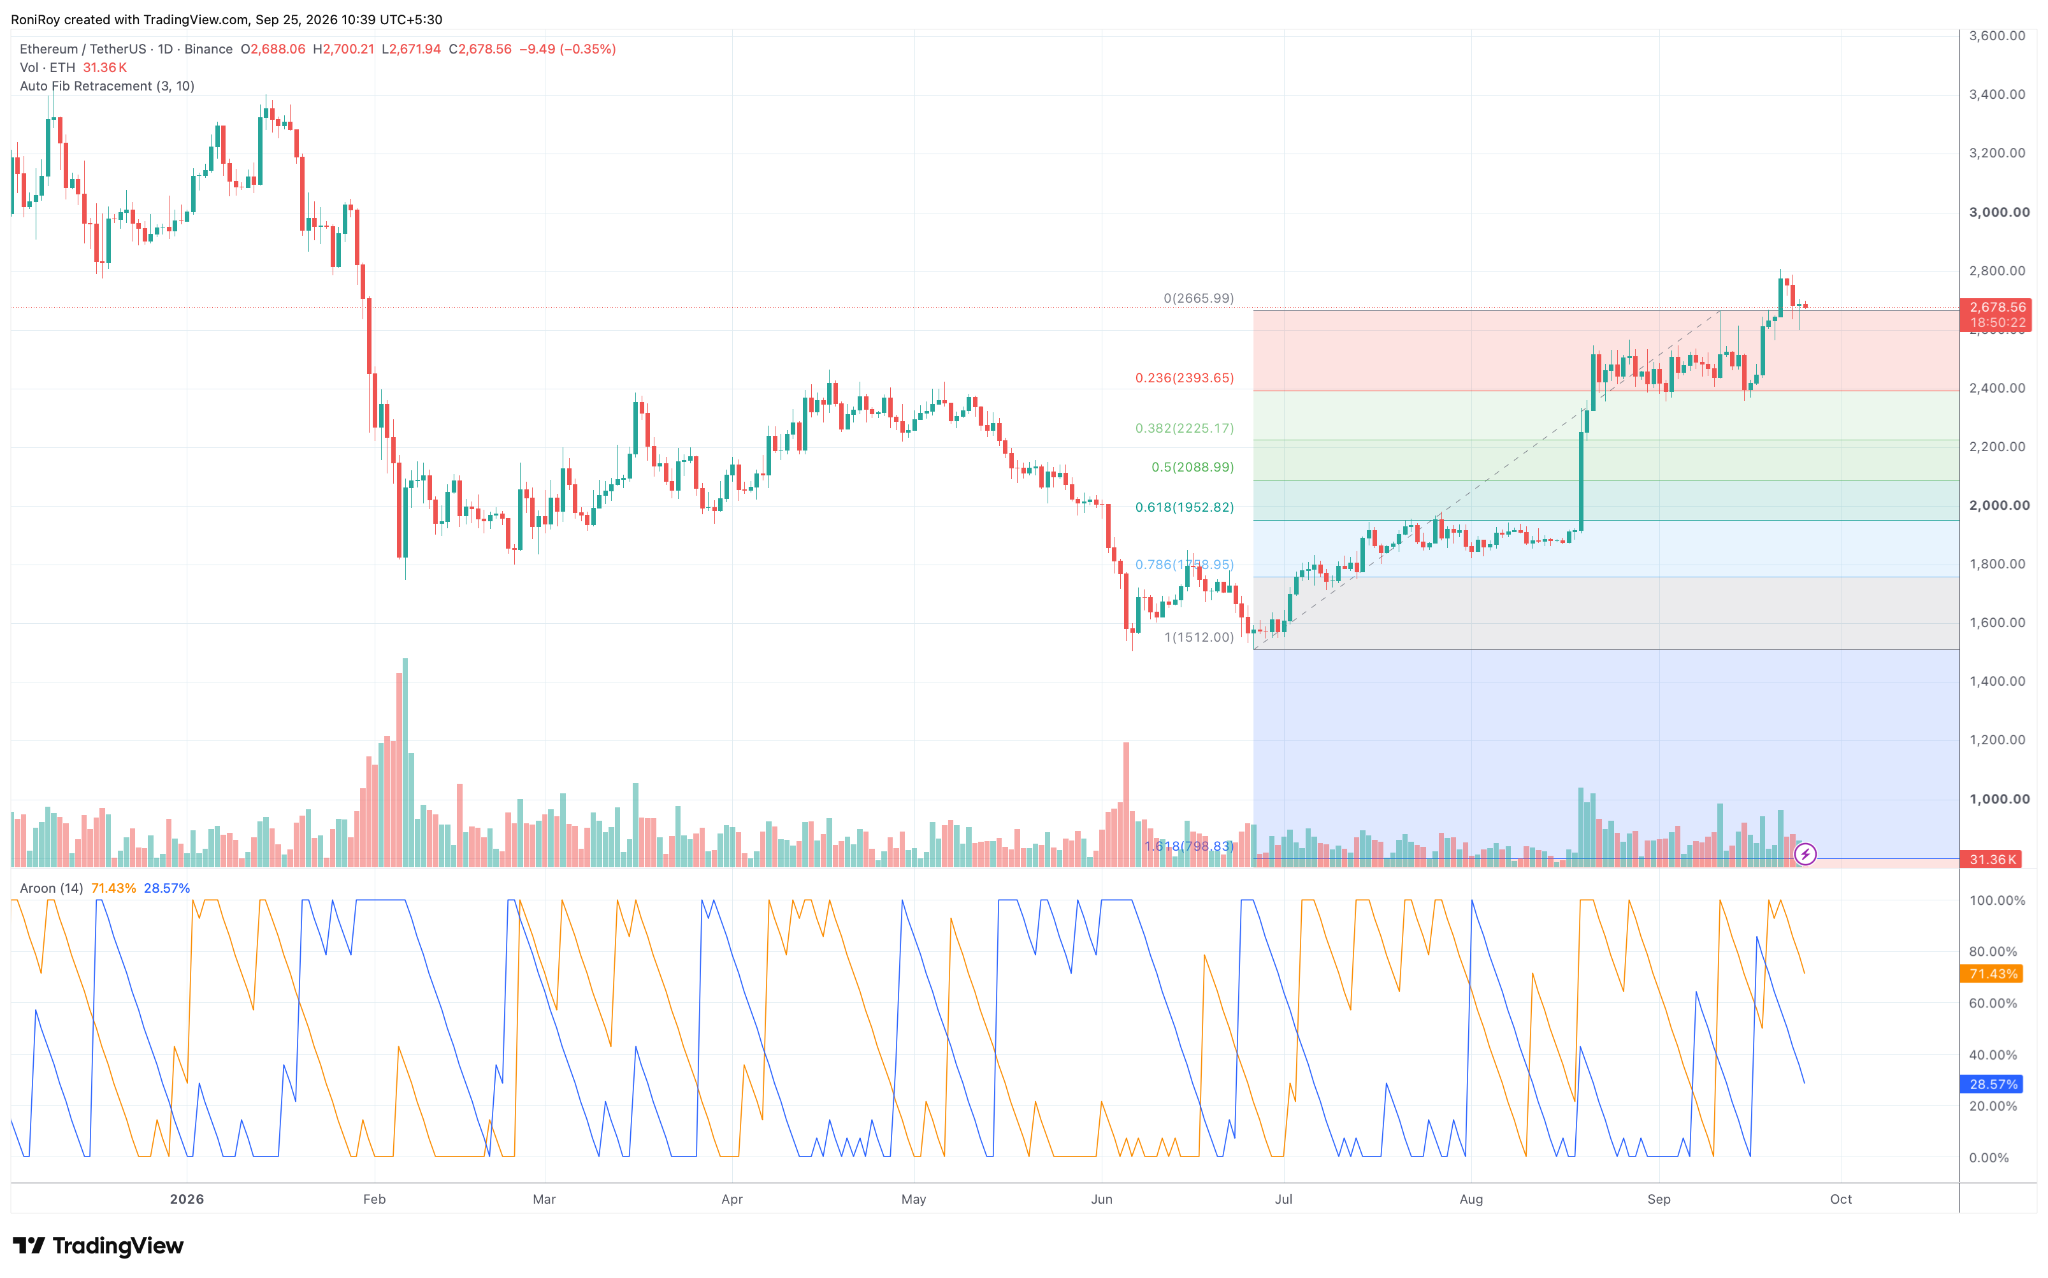
Meanwhile, Aroon gives a similar reading on the daily timeframe. Aroon Up stands at 71.43%, compared with Aroon Down at 28.57%.
$ETH/$USDT 1-day price chart. Source: TradingView.
Aroon Up has fallen from 100%; however, $ETH has spent seveAroonral sessions below its latest high.
A return in Aroon Up towards 100% alongside a break above $2,800 would confirm a new daily high. $ETH could then target $2,900, followed by the psychological $3,000 level.
The Fibonacci structure shows how far $ETH has already moved from its June low near $1,512.
The previous swing high used for the retracement sits near $2,666, which $ETH has now moved above, while the 0.236 retracement lies much lower at $2,394.
Holding above $2,666 would keep $ETH close enough to retest $2,780 to $2,800. A daily close above $2,800 would leave $2,900 as the next probable target before $3,000.
Failure to hold $2,625 would instead expose the Ichimoku support cluster between $2,610 and $2,582.
Below it, $2,550 and $2,500 become the next areas to watch, while the Fibonacci 0.236 level near $2,394 would become relevant if $ETH loses $2,500 and returns towards its September breakout zone.

 crypto.news

 en.bitcoinsistemi.com
 coinfomania.com
