


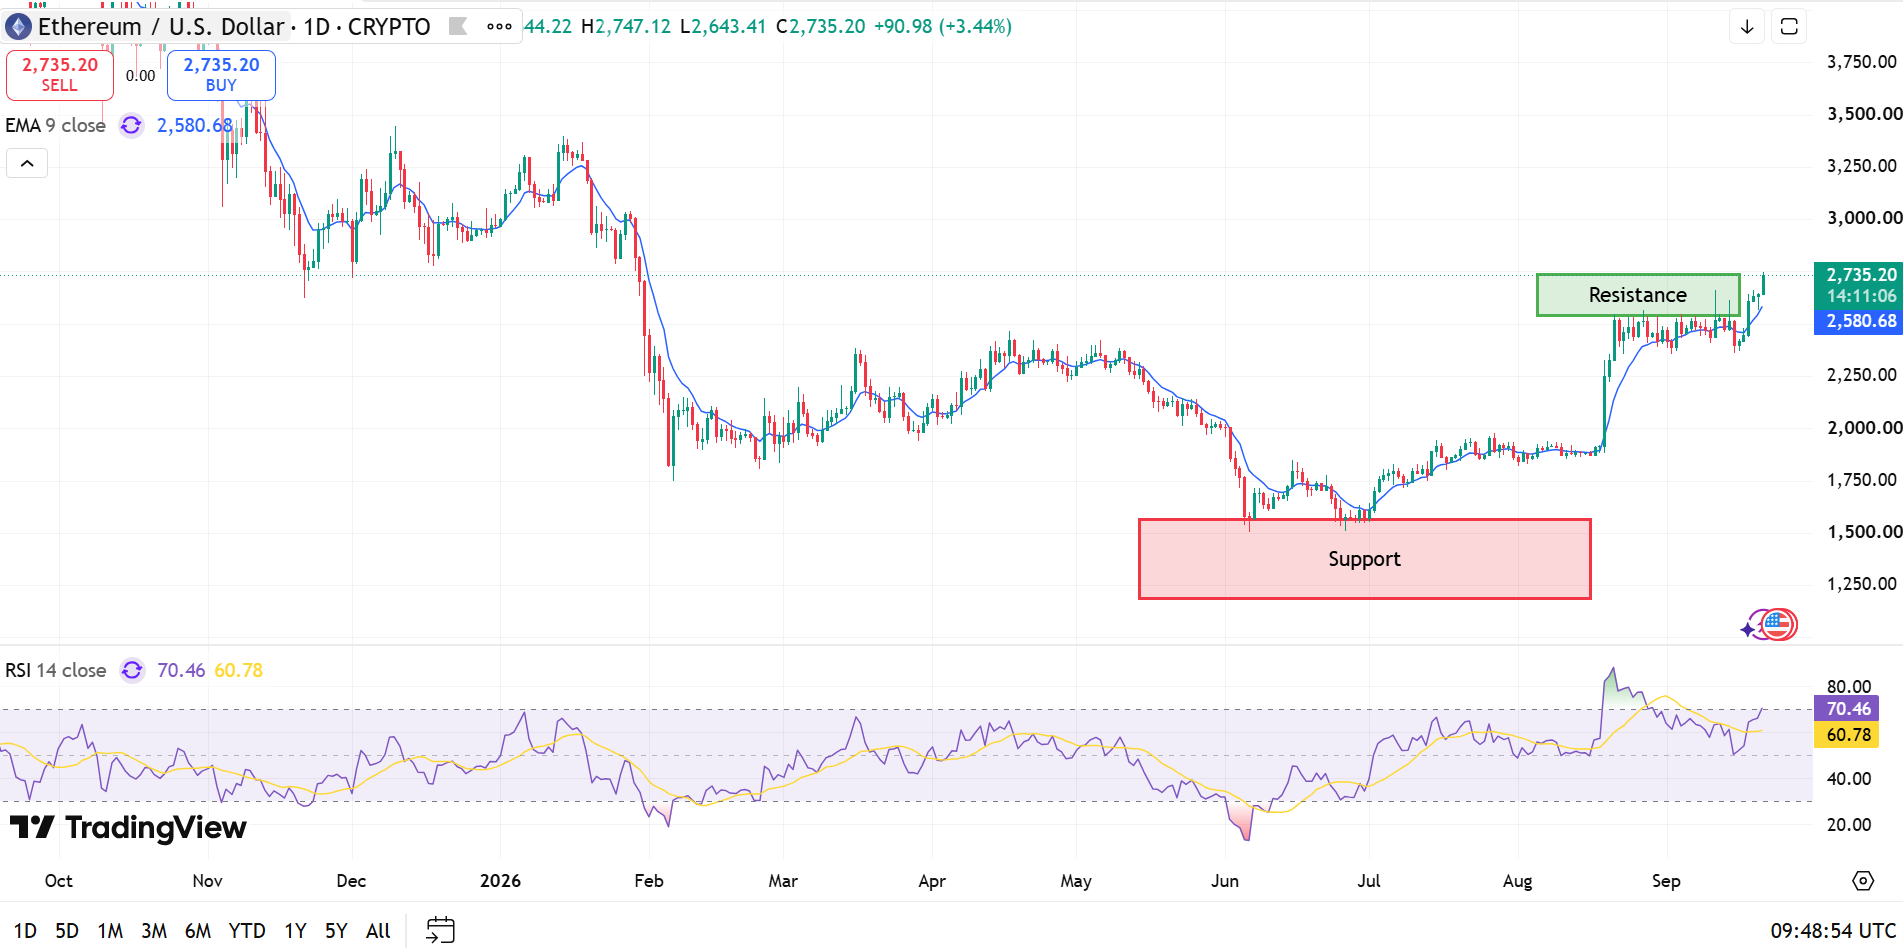
Ethereum price is approaching a level that could decide where the next move goes. $ETH reached $2,735.20 on the daily chart, up 3.44% or $90.98 on the chart . The move has brought $ETH into the $2,600–$2,800 resistance zone, an area the charts have marked as a key test for the current rally. The higher-timeframe analysis points to a bullish Change of Character (CHoCH) after $ETH moved away from the roughly $2,300 demand region. Price also reclaimed the $2,483–$2,584 Fair Value Gap (FVG), which is now one of the main support areas to watch.
Ethereum Price Moves Toward $2,800
The daily chart gives a straightforward picture of where Ethereum price stands. $ETH is trading inside the $2,600–$2,800 resistance zone, with the top of that range sitting near $2,800. Momentum is also strong. The 9-day EMA is at $2,580.68, putting $ETH roughly $154 above the indicator. Daily RSI is at 70.46, which puts it above the traditional overbought threshold of 70.
The 2-day chart adds more context. $ETH was around $2,665.29 on that chart, with the next upside Fair Value Gap located between $2,800 and $2,900. Beyond that, the chart marks $3,200–$3,400 as another major resistance area containing a bearish order block and FVG.
ETHEREUM: HTF STRUCTURE JUST SHIFTED | WHAT COMES NEXT?$ETH Is Now Showing A Clear HTF Bullish CHoCH On The HTF Chart, Followed By Strong Displacement From The ~$2,300 Demand Region.
— Crypto Patel (@CryptoPatel) September 21, 2026
Price Has Reclaimed The $2,483–$2,584 Fair Value Gap, Making This The Most Important Near-Term… pic.twitter.com/dbZh4ivM05
The 4-hour chart shows the same battle playing out at a shorter timeframe. $ETH was around $2,721.62, while the 9-period EMA stood at $2,648.76. RSI was higher at 74.89, showing that short-term buying pressure remains strong but has also pushed momentum into overbought territory.
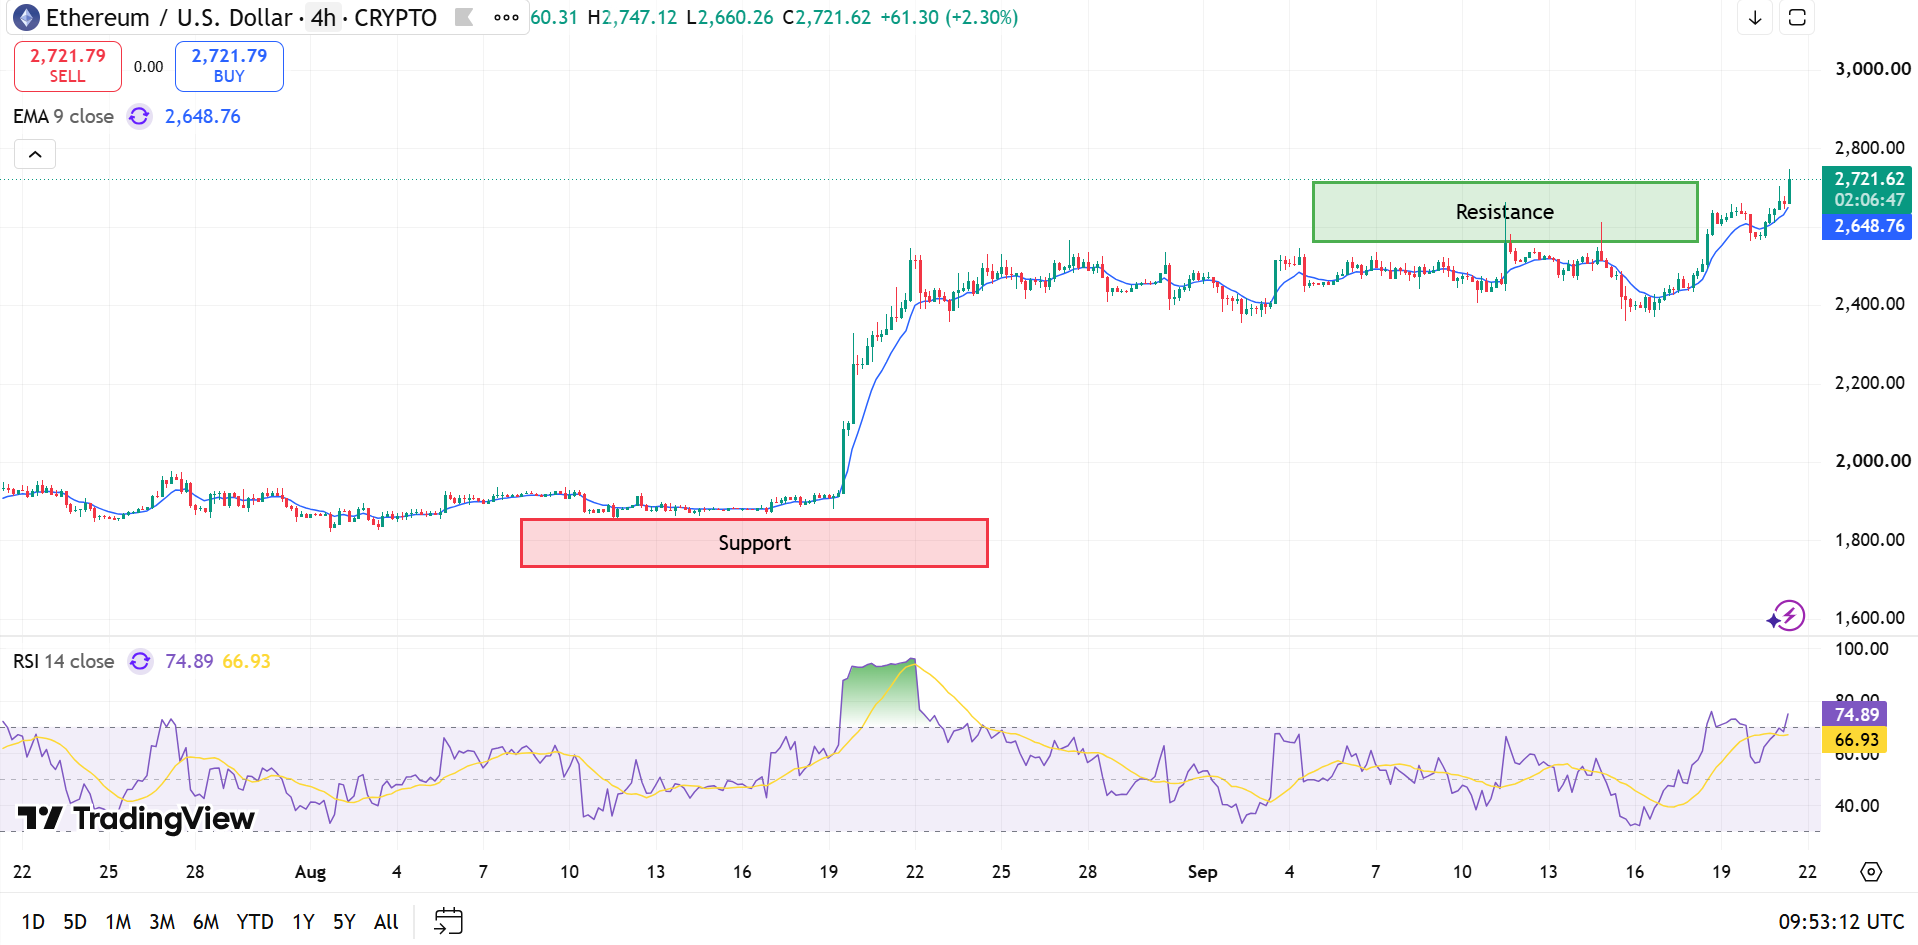
So, $2,800 is the number to watch. A 4-hour close above it would clear the current resistance box and put $2,900 and potentially $3,000 on the map, with $3,200–$3,400 coming into view after that.
Ethereum Network Activity Keeps Rising
The on-chain numbers add an interesting part to the Ethereum price setup. Ethereum’s market cap climbed from roughly $310 billion during the observed low to above $340 billion as $ETH moved toward $2,650.

Network activity also increased during the recovery. Active addresses rose from below 280,000 to almost 490,000.

Daily transactions followed a similar path, moving from below 1.45 million to more than 2 million.

There is one detail worth watching here. At the end of the observed period, active addresses and transactions reached their highest levels even as $ETH price moved lower. That creates a divergence between network activity and price and could point to short-term cooling after the rally.
What Comes Next for Ethereum Price?
The technical picture remains constructive above $2,360, which the referenced analysis identifies as the level that keeps the bullish structure intact. Above that, $2,483–$2,584 remains the key support zone.
For Ethereum price, the immediate question is simple: can $ETH clear $2,800? A break above that level could open the way toward $2,900 and then $3,200–$3,400. If sellers defend the zone, the charts point toward $2,648, $2,580 and the $2,400 area as levels to watch during a retracement. With RSI above 70 across the daily and 4-hour charts, the next move may depend less on how fast $ETH can climb and more on whether buyers can keep price above these key levels.

 coinfomania.com
 u.today
 cryptoslate.com
 coindesk.com
