



 2
2
Ethereum enters September near $2,440 after rallying from $1,900 to above $2,500 in late August. The $2,550 level is where sellers have rejected two breakout attempts. Meanwhile, $ETH has also formed a higher cycle high while Bitcoin has not, suggesting stronger relative momentum.
Ethereum Price Analysis: Can $ETH Break $2,550 to Confirm the Wedge?
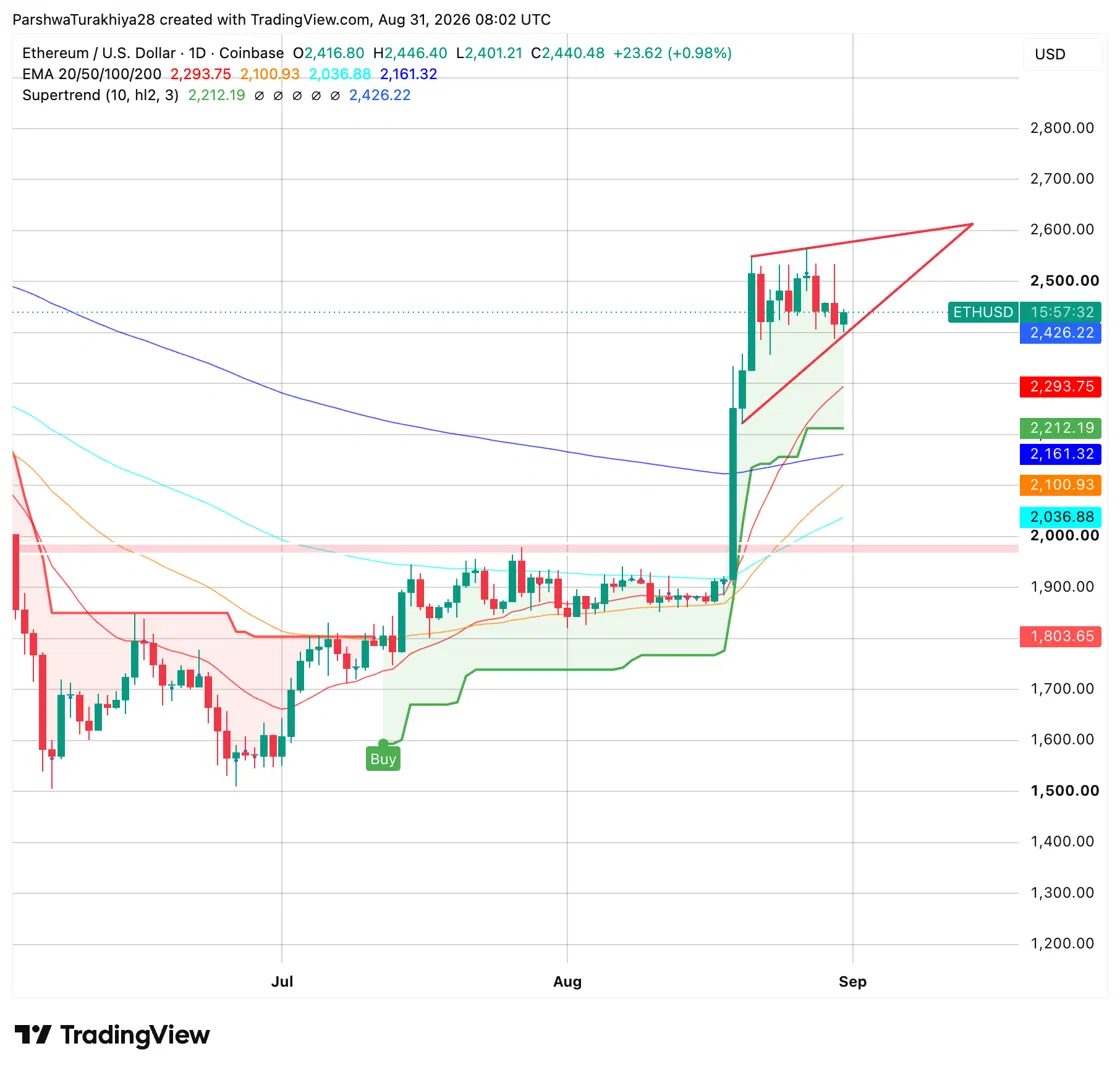
$ETH trades at $2,440.48, up 0.98%, while consolidating below the wedge’s upper boundary. Analyst Ted Pillows identified $2,550 as the critical breakout level after $ETH failed to hold above it during its latest attempt.
The Supertrend remains bullish at $2,212.19. Moreover, $ETH trades above its 20-day EMA at $2,293.75, 50-day EMA at $2,100.93, 100-day EMA at $2,036.88 and 200-day EMA at $2,161.32.
Price trading above all four averages supports the recovery. However, the averages have not formed a textbook bullish alignment because the 200-day EMA remains above the 50-day and 100-day EMAs.
Related: Cardano Price Prediction: Is the September 15 Clarity Act Vote About to Move ADA?
A daily close above $2,550 would invalidate the wedge’s bearish risk and strengthen the case for a move toward $2,800. Conversely, a breakdown below $2,293 could expose the Supertrend and 200-day EMA.
$ETH Support and Resistance Levels, September 2026
| Type | Price | Level |
| Resistance | $2,550 | Wedge resistance, prior rejection |
| Support | $2,293.75 | 20-day EMA |
| Support | $2,212.19 | Supertrend |
| Support | $2,161.32 | 200-day EMA |
| Support | $2,036.88 | 100-day EMA |
September Seasonality: Historically Weak, But August Just Broke the Pattern
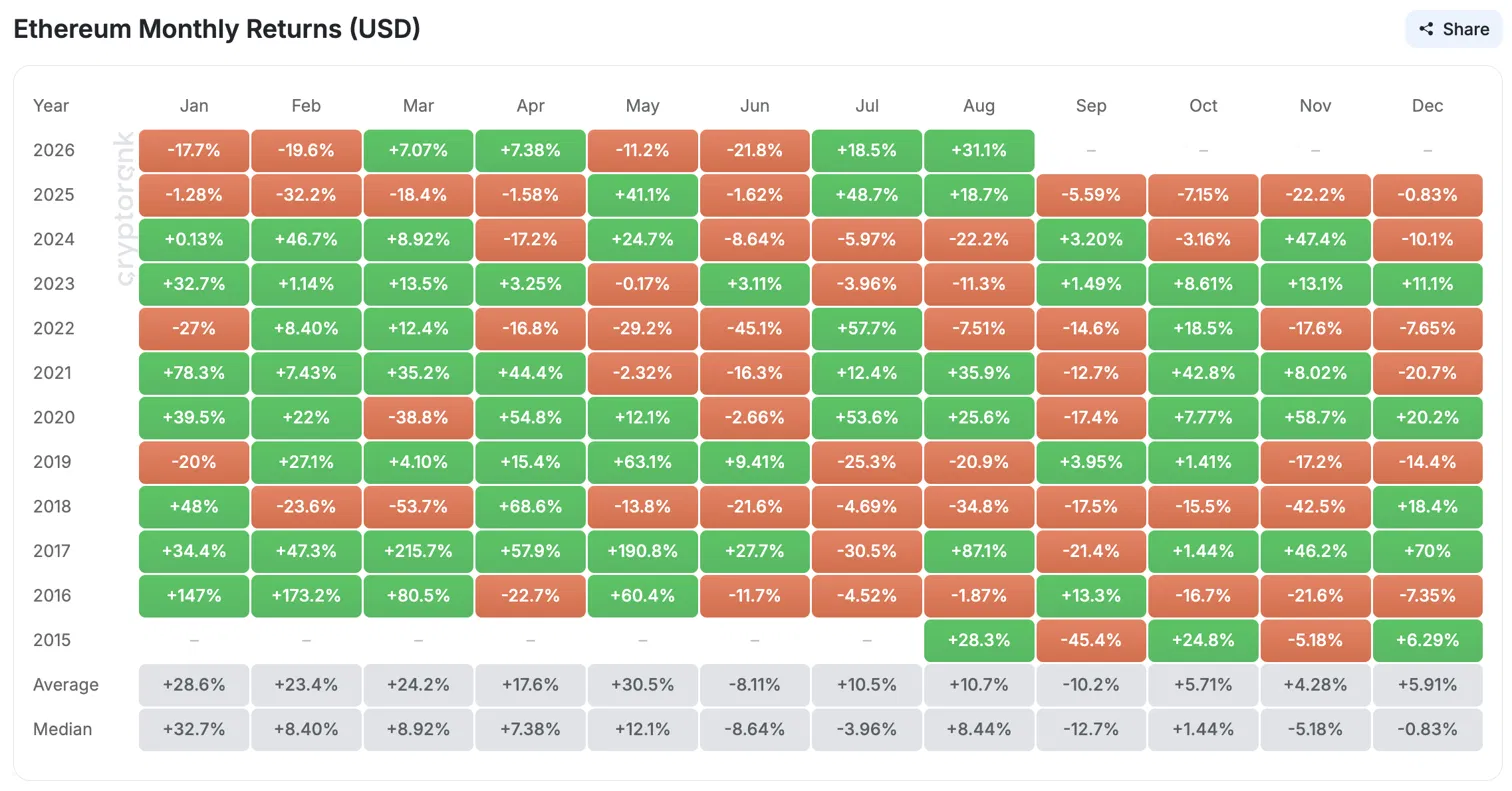
September has historically ranked as Ethereum’s second-weakest month. $ETH has produced an average September return of -10.2% and a median return of -12.7%, with only four of 11 Septembers closing higher.
That seasonal weakness deserves attention after $ETH gained 31.1% in August 2026. A strong August does not automatically signal a September reversal, but it raises the risk of profit-taking near resistance.
| Year | September Return |
| 2025 | -5.59% |
| 2024 | +3.20% |
| 2023 | +1.49% |
| 2022 | -14.6% |
| 2021 | -12.7% |
| 2020 | -17.4% |
| 2019 | +3.95% |
| 2018 | -17.5% |
| Average | -10.2% |
| Median | -12.7% |
Ethereum News: Tom Lee Sees $6,000 $ETH as a “Conservative” Target
LATEST: 📈 Tom Lee said Ethereum could reach around $6,000 if Bitcoin hits $150,000, telling Milk Road it's actually a conservative price target. pic.twitter.com/4zD7y6TGTn
— CoinMarketCap (@CoinMarketCap) August 30, 2026
Fundstrat’s Tom Lee told Milk Road that $ETH could reach roughly $6,000 if Bitcoin hits $150,000, and called that a conservative estimate rather than an aggressive one.
Separately, Arthur Hayes told Cointelegraph that Ethereum currently offers the best risk-reward in crypto, saying $ETH could deliver a 3-5X move quickly, and noted that rival asset Hyperliquid no longer offers the same relative upside.
Ethereum News: $ETH Posts a Higher High Where $BTC Hasn’t
$ETH is holding above the $2,450 level.
— Ted (@TedPillows) August 30, 2026
Any 15%-20% dip in Ethereum will be for buying, as the bottom is most likely in. pic.twitter.com/ds8psBdjU7
Analyst Ted Pillows said Ethereum’s ability to hold near $2,450 supports his view that $ETH has likely established its cycle bottom. He added that he would treat any 15%-20% pullback as a buying opportunity rather than evidence of a renewed downtrend.
Related: Helium Price Prediction: HNT Eyes $1 After 358% Surge
A 15%-20% decline from $2,450 would place $ETH between roughly $1,960 and $2,080, close to its 50-day and 100-day EMAs. This makes that technical zone important if September’s historically weak seasonality triggers a deeper correction.
Ethereum News: ETF Inflows Set a Record for the Second Straight Week
$ETH ETFs pulled in $824.42M for the week ending August 28, the highest weekly total of 2026, surpassing the prior week’s record of $697.18M according to SoSoValue. Daily inflow on August 28 alone came in at $102.18M, led by BlackRock’s ETHA with $83.79M. Cumulative net inflow across all $ETH ETFs now stands at $12.97B, with total net assets reaching $15.23B.
| Week Ending | $ETH ETF Weekly Net Inflow |
| Aug 28, 2026 | $824.42M (2026 record) |
| Aug 21, 2026 | $697.18M (prior record) |
| Aug 14, 2026 | -$2.26M |
| Aug 7, 2026 | $244.94M |
Ethereum Derivatives: Volume Explodes as Shorts Take the Losses
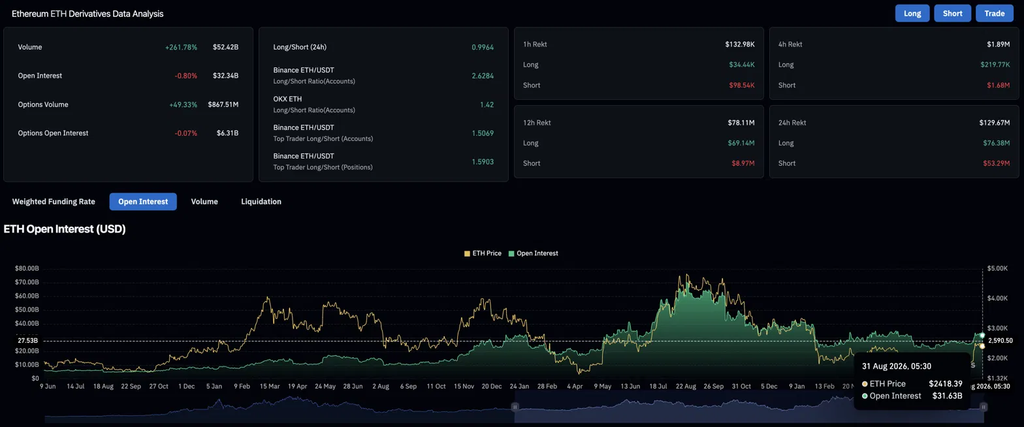
$ETH derivatives volume jumped 261.78% to $52.42 billion over 24 hours, while open interest slipped 0.80% to $32.34 billion. The combination points to heavy contract turnover and position closures rather than traders building substantial new exposure.
Options volume also increased 49.33% to $867.51 million. Meanwhile, Binance’s long-to-short account ratio reached 2.6284, compared with 1.42 on OKX, showing that tracked accounts favored long positions.
Liquidations presented a mixed picture. Long traders lost $76.38 million over 24 hours, exceeding the $53.29 million liquidated from shorts. However, shorts accounted for $1.68 million of the $1.89 million liquidated during the latest four-hour period, indicating a more recent squeeze against sellers.
| Metric | Value | What it shows |
| Derivatives volume (24h) | $52.42B, up 261.78% | Trading activity exploded |
| Open interest | $32.34B, down 0.80% | Active trading, not new leverage building |
| Binance long/short ratio | 2.6284 | Traders heavily favor further upside |
| 4h short liquidations | $1.68M of $1.89M | Sellers getting squeezed in recent price action |
$ETH Price Prediction September 2026: Upside and Downside Targets
Bullish Case, Target: $2,800
$ETH clears $2,550 on a daily close, confirming the wedge breakout Ted Pillows flagged as still pending. Record ETF inflows for a second straight week and bullish commentary from Tom Lee and Arthur Hayes both support continued institutional demand. A confirmed breakout opens room toward $2,800.
Bearish Case, Risk Level: $2,161.32 (200-Day EMA)
$ETH fails at $2,550 for a third time and September’s historically weak seasonality takes hold, especially after such a strong August. ETF inflows cool from their record pace, and price falls back toward the 200-day EMA at $2,161.32.
Expert Insight
Record ETF inflows alongside slightly lower open interest suggest that spot investment, rather than expanding derivatives exposure, is supporting $ETH’s recovery. That makes the rally potentially less fragile than one driven mainly by speculative contracts. However, larger 24-hour long liquidations show that bullish positioning remains vulnerable while $ETH trades below $2,550.
Related: Seeker Price Prediction: SKR Open Interest Explodes as September Breakout Looms
FAQs
$ETH trades at $2,440.48, consolidating inside a rising wedge below $2,550. The bullish target is $2,800 if the wedge breaks out, while the bearish risk level is $2,161.32 at the 200-day EMA if $2,550 fails a third time.
$ETH setting a higher high this cycle while Bitcoin hasn’t, suggests $ETH may have already found its cycle low, even though $ETH still needs to confirm a breakout above $2,550 to fully validate that read.
Yes, historically. September has averaged a -10.2% return for $ETH over eleven years, its second-weakest month on the calendar, with only four of eleven years closing positive.
It’s conditional on Bitcoin first reaching $150,000, a level $BTC hasn’t approached this cycle, so the $6,000 $ETH target depends on a catalyst that hasn’t happened yet rather than being grounded in $ETH’s current price action alone.
Very strong. $ETH ETFs pulled in $824.42 million for the week ending August 28, a 2026 record that broke the prior week’s own record of $697.18 million, marking back-to-back record weeks.
$ETH is showing a genuinely bullish technical stack and record ETF demand, but it’s also walking into a historically weak month after one of its strongest Augusts, and the more ambitious analyst targets depend on Bitcoin reaching levels it hasn’t hit yet. This is not financial advice, so weigh the bullish and bearish cases above against your own research and risk tolerance.

 crypto.news
 en.cryptonomist.ch
 cryptopotato.com + 1 more