


Ethereum price climbed 3% to about $2,397 on Aug. 21 after reaching an intraday high near $2,448, extending a breakout driven by ETF inflows, short liquidations and stronger risk appetite.
Ethereum price action today
According to data from crypto.news, Ethereum ($ETH) price opened at $2,327 on Aug. 21 before climbing to $2,448 and settling near $2,397 at the time of writing. The 3% daily increase followed a much larger move that carried $ETH from below $2,000 to more than $2,300 within two sessions.
The rally pushed Ethereum through several levels that had limited gains since April, including the $2,000 psychological barrier and the $2,250 resistance area. $ETH also cleared the $2,375 Murrey Math level on the 4-hour chart, although the price was struggling to hold above it after its rejection near $2,450.
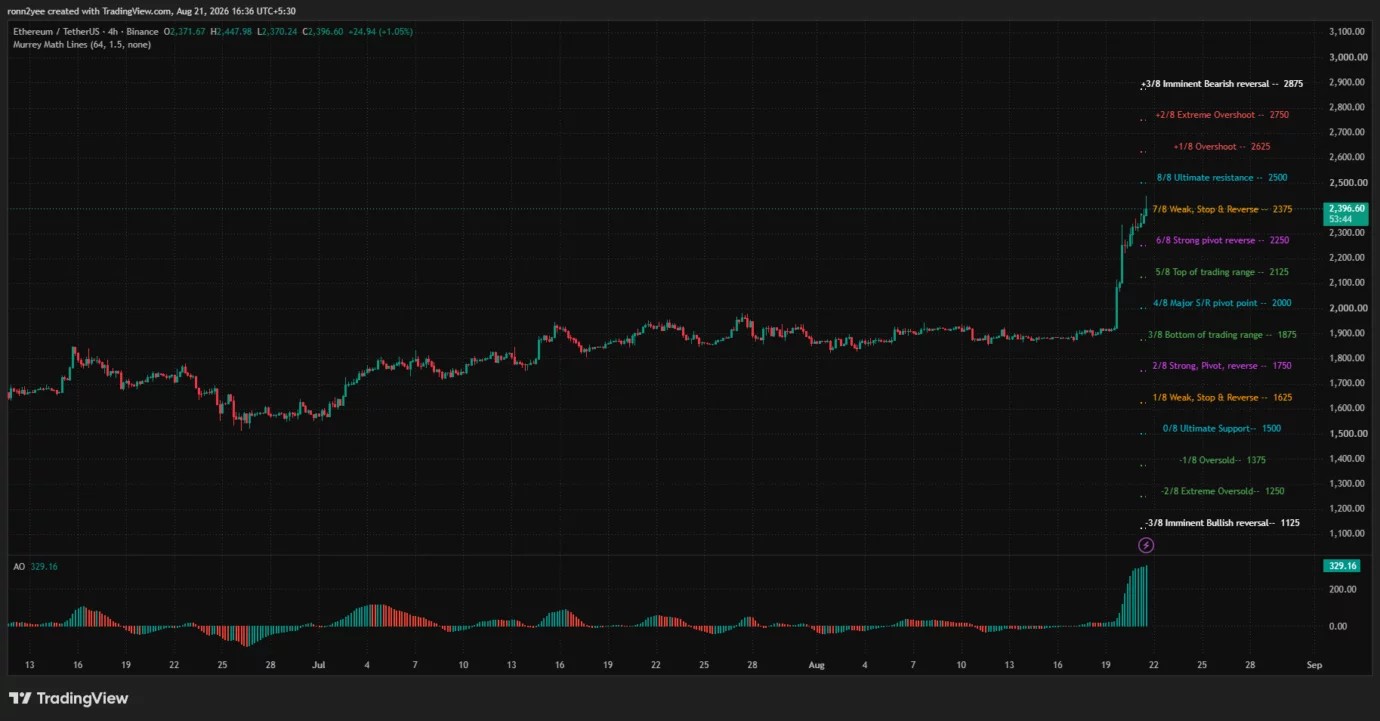
Momentum remained strong on the shorter timeframe. The 4-hour Awesome Oscillator rose to 329.16 and printed an expanding series of green bars, indicating that upward momentum had not yet weakened meaningfully.
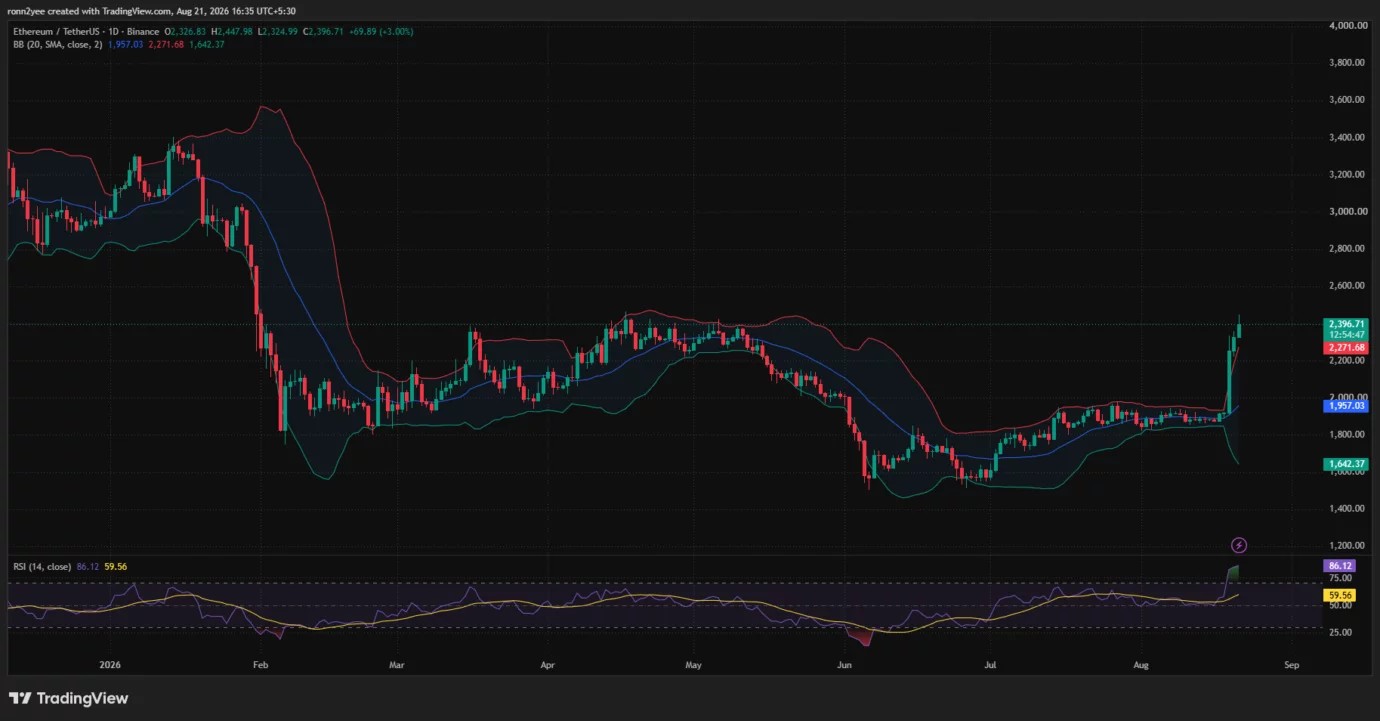
However, the daily chart showed that $ETH had moved far outside its previous trading range. The price was trading about 5.5% above the upper Bollinger Band at $2,272, while the indicator’s middle band remained near $1,957.
What is driving the Ethereum rally?
US spot Ether ETFs recorded $189 million in net inflows on Aug. 19, their strongest daily intake since October 2025, according to SoSoValue data. BlackRock’s ETHA accounted for about $122 million of that total.
The ETF purchases arrived as Ethereum broke above $2,000, forcing traders with leveraged short positions to close their bets. CoinGlass data cited by Invezz showed that more than $1 billion in Ether shorts were liquidated during the initial breakout, contributing to a wider crypto liquidation event that exceeded $3 billion.
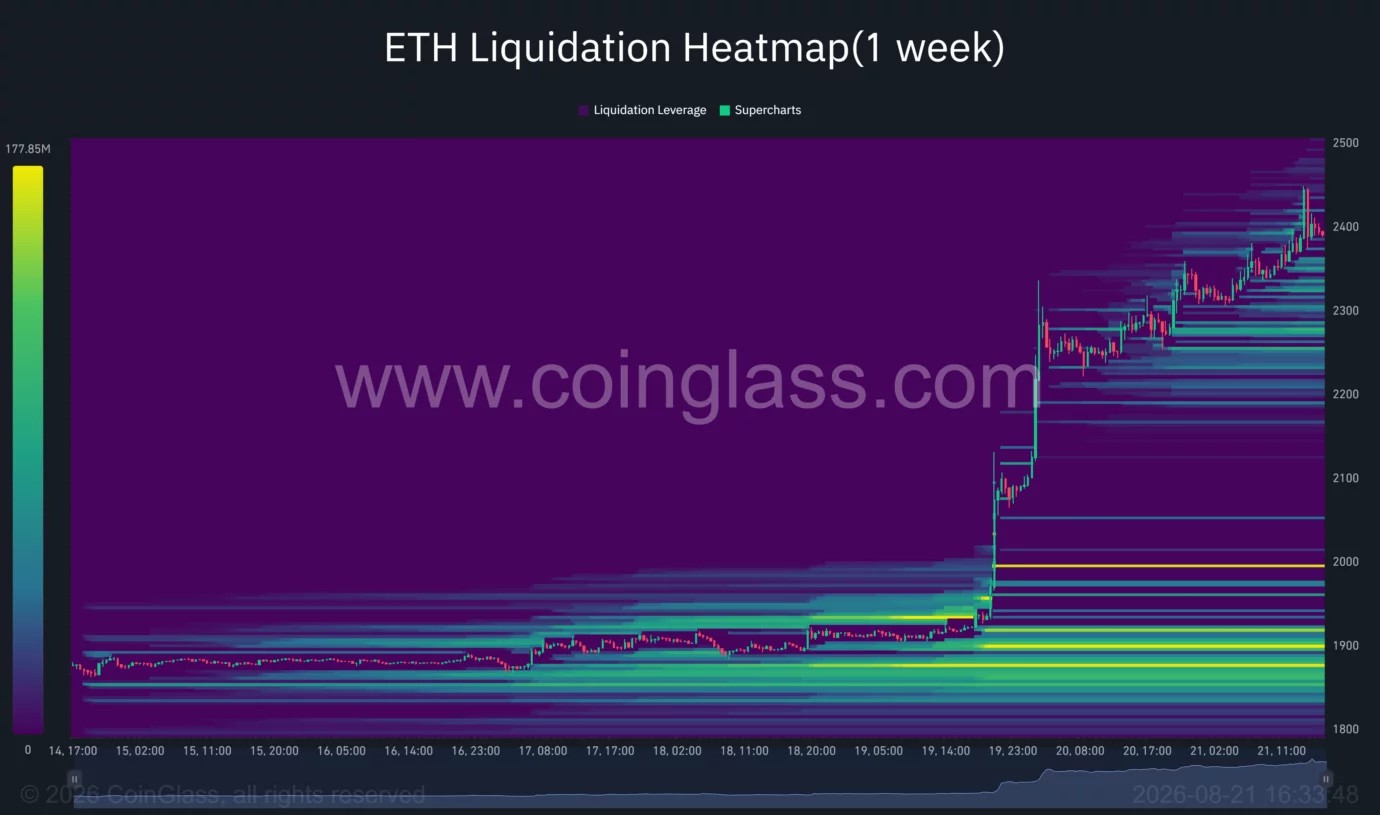
The supplied one-week CoinGlass heatmap shows how $ETH moved rapidly through liquidation clusters between $1,900 and $2,300. Forced purchases associated with short liquidations likely added to the speed of the advance, although the breakout also coincided with new spot demand from US-listed funds.
Macro conditions provided another catalyst after the US Treasury announced that it would at least double the maximum size of buybacks for longer-dated nominal securities from $2 billion to $4 billion per operation. The change will begin on Sept. 9 and remain in place through Nov. 4.
Investors interpreted the announcement as support for bond-market liquidity. Treasury yields and the US dollar subsequently weakened, helping Bitcoin, Ethereum, and other risk assets extend their gains.
Ethereum faces overbought signals below $2,500
Ethereum’s immediate resistance sits between $2,448 and $2,500. The lower boundary marked the Aug. 21 intraday high, while the Murrey Math chart identifies $2,500 as the next major resistance level.
A sustained break above $2,500 could expose $2,625, followed by $2,750. The chart places stronger reversal risk near $2,875, although $ETH would need additional demand to reach those levels after such a steep move.
Daily momentum presents the main short-term risk. Ethereum’s 14-day relative strength index jumped to 86.12, well above the 70 level commonly associated with overbought conditions. The reading does not guarantee a reversal, but it shows that prices have advanced much faster than their recent trend.
The CoinGlass heatmap identifies nearby liquidation concentrations between approximately $2,270 and $2,350. A failure to clear $2,450 could therefore send $ETH back toward $2,375, followed by the $2,300–$2,250 area.
The $2,000 level remains the larger breakout support. The daily Bollinger Band midpoint near $1,957 and a dense heatmap cluster around $1,990 strengthen that zone, although a decline that deep would erase much of the latest advance.
Analysts watch the $2,450 weekly close
Crypto analyst Ted Pillows identified $2,450 as Ethereum’s next resistance zone. He said a weekly close above that area could open a move toward $3,000, making the upcoming close important for confirming whether the breakout can continue.
Market analyst Rain said $ETH gained 17.1% during the initial daily surge and pushed its weekly advance beyond 20% after clearing resistance between $1,980 and $2,000. Rain also reported that 30-day realized volatility rose from 39.6 to 62.6 in one day, showing how quickly the earlier compression ended.
Ethereum just delivered one of its sharpest moves of the year.
— Rain (@raintures) August 21, 2026
But the breakout is only the first part of the story.$ETH surged 17.1% in a single day and has since pushed above $2,370, taking its weekly gain beyond 20%.
The move followed weeks of tightening consolidation,… pic.twitter.com/dbWq01KK7Y
Rain said Ethereum must now prove that $2,000 can function as support. Holding well above that level would preserve the new market structure, while a deeper reversal would suggest that liquidations contributed more to the move than sustained spot demand.
US regulation adds to Ethereum’s market catalyst
The rally also followed the SEC’s Regulation Crypto Assets proposal, published on Aug. 18. The proposed framework would introduce tailored registration exemptions for certain investment contracts involving crypto assets, including fundraising exemptions of up to $75 million annually.
The proposal has not become law and does not change Ethereum’s regulatory status immediately. However, the SEC said it aims to give crypto issuers clearer pathways under federal securities laws, adding to the improved regulatory backdrop for US investors.
Ethereum’s next move now depends on whether ETF demand and spot buying can absorb profit-taking near $2,450. A confirmed breakout would bring $2,500 into focus, while rejection could produce a cooling period toward $2,375 or $2,300 as the overbought daily RSI resets.

 cryptoticker.io
 invezz.com
 en.cryptonomist.ch