



 14
14
Ethereum trades at $1,856.19 on August 3, down 1.44%, consolidating inside a Fibonacci range between $1,837 and $1,939 as a descending trendline from the May peak continues to cap recovery attempts.
$ETH Holds the 0.382 Fibonacci but the Descending Trendline Has Not Broken
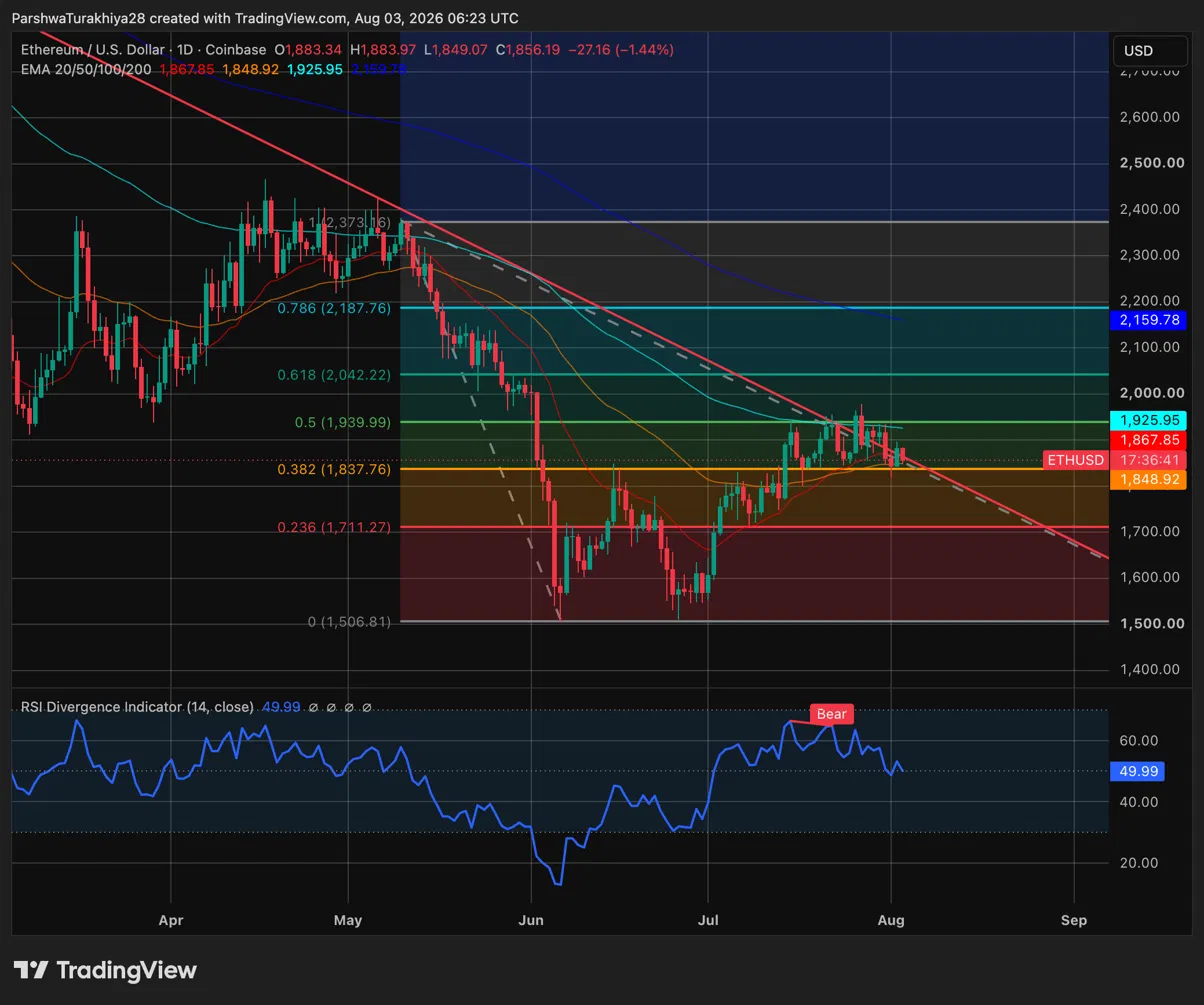
$ETH is trading between the 0.382 Fibonacci at $1,837.76 and the 0.5 level at $1,939.99, with today’s session sliding from a high of $1,883.97 to close at $1,856.19. The 20-day EMA at $1,867.85 sits just above as the immediate ceiling, while the 50-day at $1,848.92 is the first support below.
A descending trendline from the May peak near $2,373 continues to reject price around $1,900, and the 100-day EMA at $1,925.95 clusters with that trendline, making the $1,925 to $1,940 zone the key area to clear before $2,000 comes into play. RSI at 49.99 is sitting right at neutral with a bearish divergence signal, meaning momentum has not confirmed the recovery yet.
$ETH Support and Resistance Levels, August 3, 2026
| Type | Price | Level |
| Resistance | $1,867.85 | 20-day EMA, immediate ceiling |
| Resistance | $1,925.95 | 100-day EMA, aligns with descending trendline |
| Resistance | $1,939.99 | 0.5 Fibonacci |
| Resistance | $2,042.22 | 0.618 Fibonacci |
| Resistance | $2,159.78 | 200-day EMA, longer term ceiling |
| Support | $1,848.92 | 50-day EMA, first support below |
| Support | $1,837.76 | 0.382 Fibonacci, key floor |
| Support | $1,711.27 | 0.236 Fibonacci |
| Support | $1,506.81 | June low, Fibonacci base |
Spot $ETH ETFs Log a Fourth Consecutive Week of Inflows
Spot Ethereum ETFs recorded a $9.03M daily net inflow on July 31, bringing the weekly total to $27.42M and extending $ETH’s inflow streak to four consecutive weeks according to SoSoValue. That run follows weekly inflows of $103.90M, $105.44M, and $84.42M in the three prior weeks, making the July 31 week the softest of the four but still positive. Cumulative net inflows across all products now stand at $11.21B with total net assets at $10.23B.
The contrast with Bitcoin ETFs is notable. $BTC spot products posted a $265.37M single day outflow on July 31, snapping three weeks of inflows, while $ETH products held positive for a fourth straight week.
$ETH/$BTC Ratio Forms a Cup and Handle
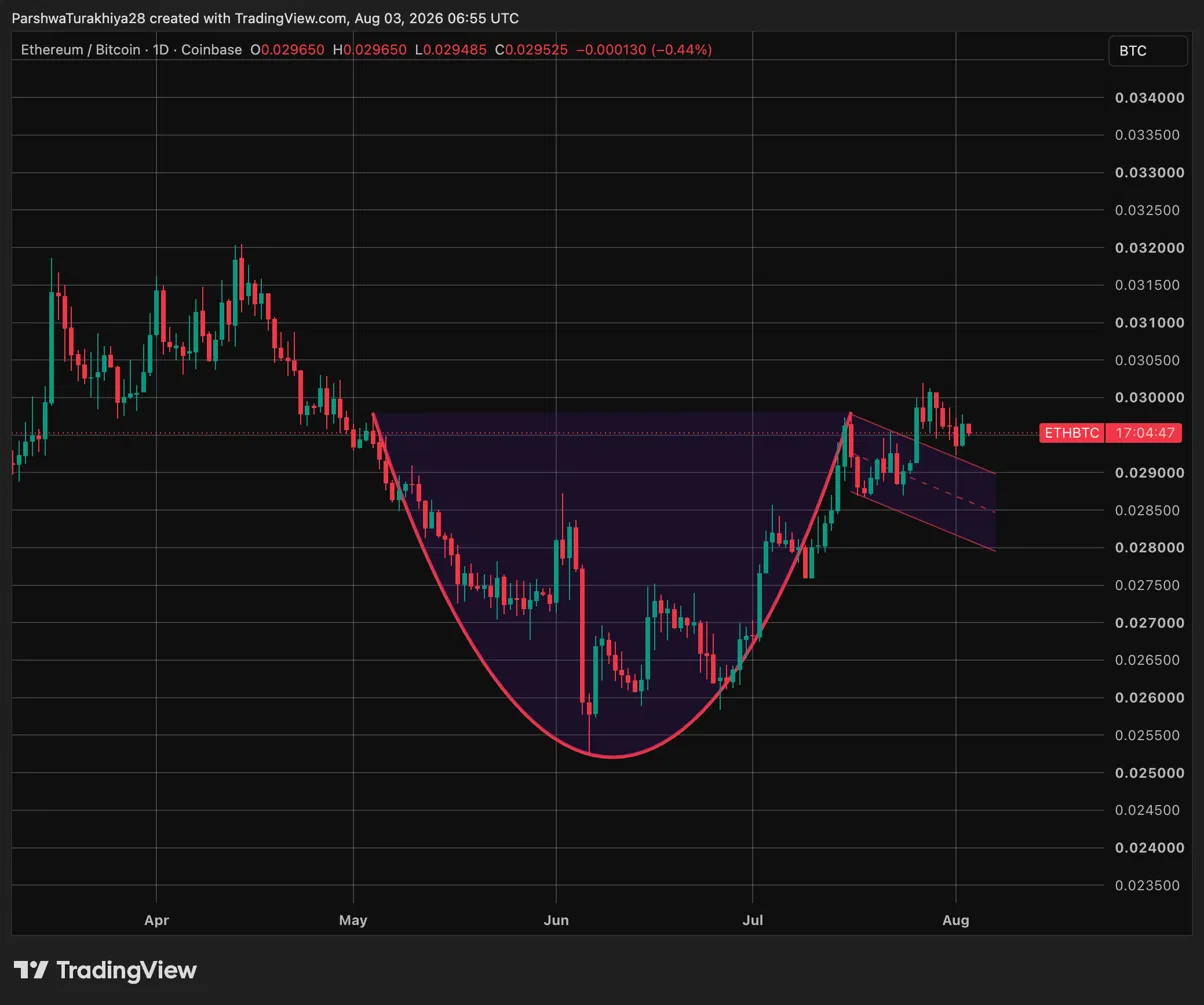
The $ETH/$BTC pair is trading at 0.029525 on the daily chart, down 0.44% on the session, but the broader structure tells a more constructive story. The ratio carved out a full cup pattern from the May high near 0.0300, bottoming around 0.0255 in June before recovering back toward the neckline. Price is now forming a handle just below the 0.030 resistance, the textbook completion of a cup and handle pattern.
A confirmed breakout above 0.030 on a daily close would signal $ETH outperforming Bitcoin in the near term, which historically aligns with broader altcoin strength. The handle’s lower boundary near 0.0285 is the level to watch on the downside. A break below that would put the recovery structure back in question and suggest Bitcoin continues to lead.
The Ethereum Valuation Debate: Scaling Without Fee Capture
➥ Ethereum is scaling faster than ever, yet $ETH is still trading below $2,000
— Tanaka (@Tanaka_L2) July 31, 2026
As someone who actually holds $ETH, I think this disconnect is the most important debate in the ecosystem right now.
Q2 numbers were not terrible, but they exposed a structural weakness:
– Ethereum… https://t.co/c8UCEkhCk9 pic.twitter.com/ke8X3XcEiI
Analyst Tanaka flagged the core tension in a July 31 thread: Ethereum is scaling faster than ever, but $ETH itself is capturing less and less of the value being created on top of it.
The Q2 data makes this concrete. Ethereum L1 generated $88.4M in Real Economic Value while applications built on it generated roughly $1.79B in fees, meaning L1 captured only 4.9% of its own ecosystem’s output. Rollups are now processing around 1,270 operations per second versus just 20.4 on L1, a 41.6x gap. Robinhood Chain alone runs at roughly 4.7 times Ethereum mainnet activity. Cheap blob fees enabled that scale, but also gutted $ETH burn, with the seven-day blob fee burn sitting at just 0.22 $ETH.
Tanaka’s argument is that the old thesis of more users driving higher gas fees and more $ETH burn no longer holds. His current bet is on institutional adoption: $17.2B in tokenized real world assets already live on Ethereum within a $299.4B stablecoin market, positioning $ETH as collateral and settlement infrastructure rather than a fee-generating asset.
| Metric | Value |
| L1 Real Economic Value | $88.4M (up 7% QoQ, down 68% YoY) |
| Application Layer Fees | ~$1.79B |
| L1 Value Capture Rate | ~4.9% of app layer fees |
| Rollup Activity | ~1,270 UOPS vs 20.4 on L1 |
| 7-Day Blob Fee Burn | ~0.22 $ETH |
| $ETH Staked | ~41.10M (33.7% of supply) |
| Tokenized RWAs on Ethereum | ~$17.2B |
Ethereum Price Prediction: Upside and Downside Targets
Bullish Case, Target: $2,042 (0.618 Fibonacci)
$ETH holds the 50-day EMA at $1,848.92 and reclaims the 20-day at $1,867.85 on a daily close, confirming the 0.382 Fibonacci as support. The descending trendline breaks as $ETH ETF inflows extend into a fifth consecutive week and the $ETH/$BTC ratio confirms a cup and handle breakout above 0.030. Price pushes through the 100-day EMA at $1,925.95 and the $2,000 psychological level toward the 0.618 Fibonacci at $2,042.22.
Bearish Case, Risk Level: $1,711 (0.236 Fibonacci)
The descending trendline continues to reject price and RSI’s bearish divergence resolves lower. $ETH loses the 50-day EMA at $1,848.92 and the 0.382 Fibonacci at $1,837.76, with the $ETH/$BTC handle breaking below 0.0285 confirming Bitcoin dominance resuming. Price slides toward the 0.236 Fibonacci at $1,711.27 as the June low at $1,506.81 comes back into view as the deeper floor.

 invezz.com

 crypto.news
 coinfomania.com