



 19
19
- Ethereum ($ETH) price is currently hovering at $1.8K.
- The downtrend intensifies in both short-term and long-term timeframes.
As of August 1, the largest altcoin, Ethereum ($ETH), is within the $1,800 range. The price has settled into a tighter band, with the session ranging between $1,847 and $1,888. Meanwhile, the 24-hour trading volume has reached $7.43 billion, down by 15%.
Notably, July ended with a reasonable gain, and August is historically a slower month for most markets. Also, the first few days of a new month tend to bring choppy price momentum and fake-outs before any clear direction emerges for the assets.
The rebound from the long-term ascending trendline played out as expected. But buyers are now facing their first technical challenge, resistance exactly where previous analysis had flagged it. Rather than collapsing after hitting that zone, $ETH has been defending a sequence of higher lows while consolidating beneath it.
Ethereum’s Potential Price Levels to Watch
Upon reclaiming the $1,880 level, the flush to $1,800 looks like the low. That is the zone which confirms the buyers are back in control of the $ETH market. Conversely, losing $1,848 opens the door to a range below $1,840 as the next crucial area to concentrate. Below that, the ascending trendline becomes the last line of defence for the broader recovery thesis.
On the upside, a confirmed breakout above the resistance zone that capped the latest advance would strengthen the developing reversal structure and move upward to continue aiming higher targets.
Moreover, volume down during consolidation beneath resistance is normal; it reflects the market waiting rather than retreating. The next decisive move above or below current levels will confirm whether July’s gains hold into August or give way to the seasonal slowdown.
Technical Outlook: Which Direction Will $ETH Move?
The $ETH/USDT pair’s Moving Average Convergence Divergence line is found below the signal line. And as both lines are below zero, the overarching market setup indicates a strong, active downtrend with expanding bearish momentum.
The negative sentiment is intensifying on both short-term and long-term timeframes. Traders often view this as a clean downtrend-continuation zone, and look for shorting opportunities until signs of a bullish crossover appear.
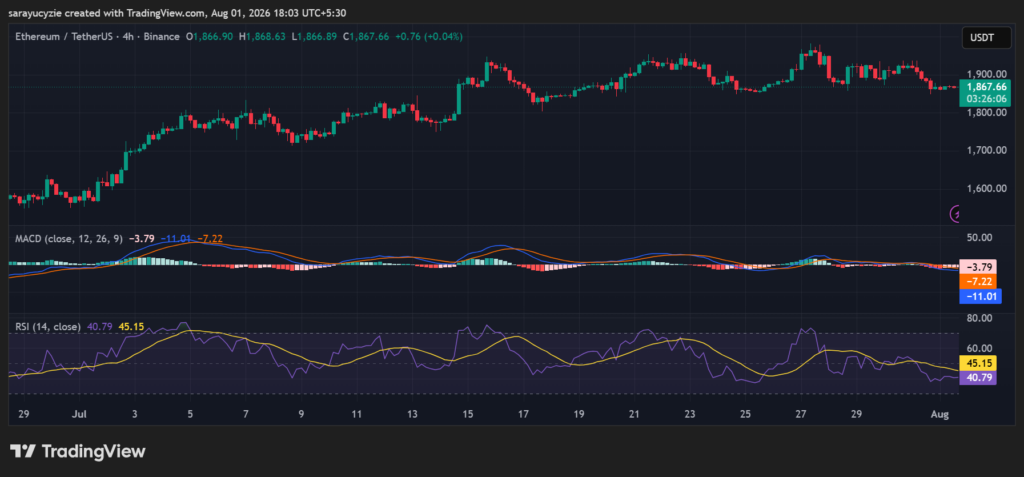
In addition, the daily Relative Strength Index (RSI) of Ethereum is at 40.79, suggesting bearish-to-neutral momentum. It shows that the sellers control the market, though not aggressively enough to trigger oversold conditions.
Being under 50 confirms that the overall market favours sellers. It is worth noting that there is still room for price to move down. Traders wait for a drop to 30 to spot buying opportunities, or a cross back over 50 to confirm a recovery.

 invezz.com
 crypto.news
 coinfomania.com
