



 10
10
Following a roughly 30% rally that started as the cryptocurrency hit lows near $1,500, Ethereum ($ETH) is now threatening a bearish reversal based on a well-regarded technical indicator.
Specifically, the top on-chain analyst on X, Ali Martinez, warned early on July 31 that TD Sequential flashed a sell signal as $ETH hit levels close to $1,980. Notably, the same indicator preceded the Ethereum rally that took the token from approximately $1,500 to the highs just under $2,000.
The TD Sequential called the Ethereum rally.
— Ali Charts (@alicharts) July 31, 2026
It flashed a buy signal near $1,500, just before a 31.5% move higher.
Now, with $ETH trading around $1,980, the indicator has flipped to a sell signal. It may be time to lock in some profits. pic.twitter.com/TLcLToGrtS
While Martinez refrained from providing a new price target for the cryptocurrency, the digital asset is – at its press-time price of $1,881.41 – already below its recent nearest support zone at $1,897.27 and is threatening to breach $1,875.28.
As of July 31, it appears likely that the $ETH price drop will either halt or pause at the third level at $1,857.75.
TD Sequential is a technical analysis (TA) tool that uses an asset’s performance over time to determine whether the prevailing trend will persist or if a reversal is in order. It was first described by the famous analyst Tom DeMark in his 1994 book ‘The New Science of Technical Analysis.’
Ethereum ($ETH) price chart
Meanwhile, despite 2026 generally seeing most cryptocurrencies on a downtrend, Ethereum has, arguably, been one of the worst-performing major digital assets. Indeed, after briefly soaring toward $3,400 in January, $ETH has spent most of the subsequent months declining and is, overall, 36.59% in the red year-to-date (YTD).
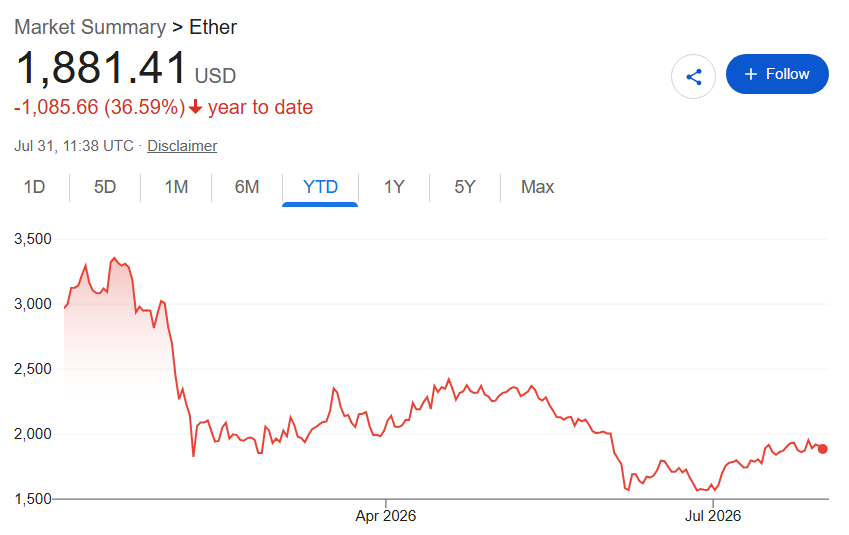
Long-term charts only paint the token as more distressed. The last 12 months saw Ethereum effectively halve in value, and $ETH is down 23.32% in the last five years.
For comparison, Bitcoin ($BTC) is down 27% YTD, fell 46.20% in the previous 52 weeks, but rose 53% since mid-2021.
Why Ethereum might soar in August despite the sell signal
Elsewhere, the CLARITY Act vote – expected on August 3 – is likely to have an outsized impact on the digital asset’s performance, potentially even invalidating indices derived from technical analysis.
Specifically, most actors within the cryptocurrency sector have been calling for Congress to provide a framework that would bring about regulatory certainty and facilitate wider, safer adoption by investors.
The expected vote – despite its results remaining uncertain – has already enabled multiple major cryptocurrencies to rally in the last 30 days and led some analysts to forecast $BTC soaring above $600,000 in the next two years should it pass.
Nonetheless, it is worth remembering that the results of the August 3 session remain unpredictable, and history has shown that the CLARITY Act might prove controversial in the long run.
Featured image via Shutterstock

 invezz.com
 crypto.news
 coinfomania.com
