



 11
11
- Ethereum is up 4%, trading at $1.9K.
- $ETH’s overall macro trend is bullish.
The largest altcoin, Ethereum ($ETH), is showing renewed strength after confirming a break of structure. Also, it has broken out of a falling wedge pattern and is now testing the upper boundary of a downtrend channel that has capped price action since September 2025.
At the time of writing, $ETH is trading at $1,962, up by over 4.43% in the past 24 hours, while trading volume has exploded 120% to $9.33 billion. Technically, Ethereum has already completed a breakout above its long-term downtrend and is now consolidating within a key demand zone.
If $ETH buyers continue defending this area, the next upside targets fall between $2,200 and $2,400, followed by $3K if bullish momentum accelerates. A sustained rally could eventually pave the way for a move to $4K, although that would depend on continued buying pressure and favourable market conditions.
Notably, the $2K level remains the most important hurdle. A weekly close above strengthens the bullish outlook and confirms a broader trend reversal. Conversely, a failure to reclaim this range could see Ethereum face renewed selling pressure and increase the risk of revisiting lower support zones.
Will Ethereum’s Bullish Momentum Continue Gaining Traction?
The 4-hour price chart of $ETH gives a positive outlook, and if it continues, the price could climb to the nearest resistance at around $1,997. As bullish pressure grows higher, the golden cross would take place, likely sending the price above $2,030.
Assuming a momentum reversal of Ethereum, the price could fall to the immediate support at $1,929. Upon a steady correction on the downside, the death cross might emerge, and the bears would take the asset’s price toward $1,895.
Zooming in on the technical chart of the $ETH/USDT trading pair, the Moving Average Convergence Divergence line is above the signal line. The short-term momentum is accelerating faster, with buyers pushing prices higher.
Both lines are above zero; the overall macro trend is bullish, and the long-term momentum is pointing up. This hints at strong buying and momentum expansion. As long as both stay above zero, the path of least resistance remains up.
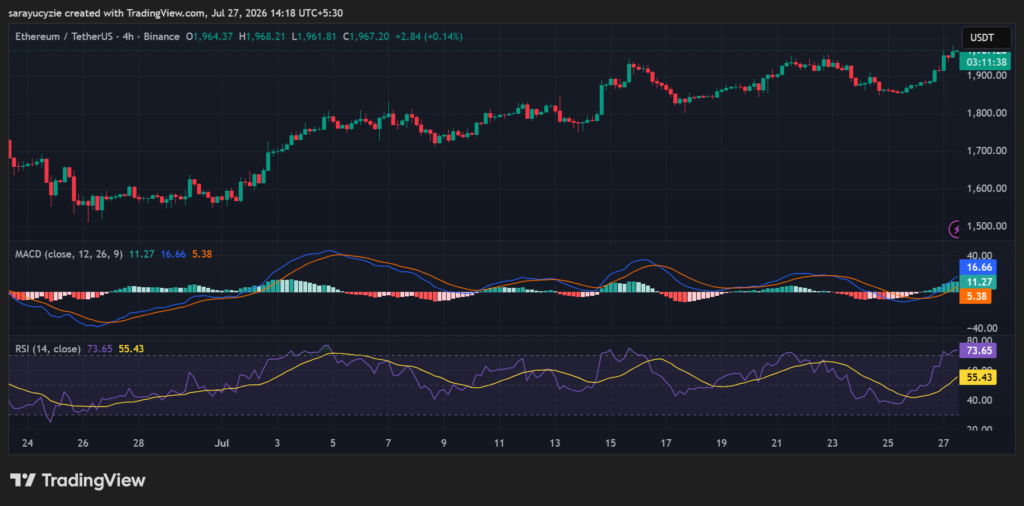
Ethereum’s daily Relative Strength Index (RSI) settled at 73.65, in the overbought territory. The buyers are in strong control and driving prices up. The higher it goes above, the higher the likelihood of a consolidation or price pullback.
However, the action of buying right now carries higher risk. Moreover, the traders wait for a divergence, a drop back below 70, before taking profit or re-entering.

 ambcrypto.com
 en.bitcoinsistemi.com

 coinpedia.org
 coinfomania.com