


 13
13
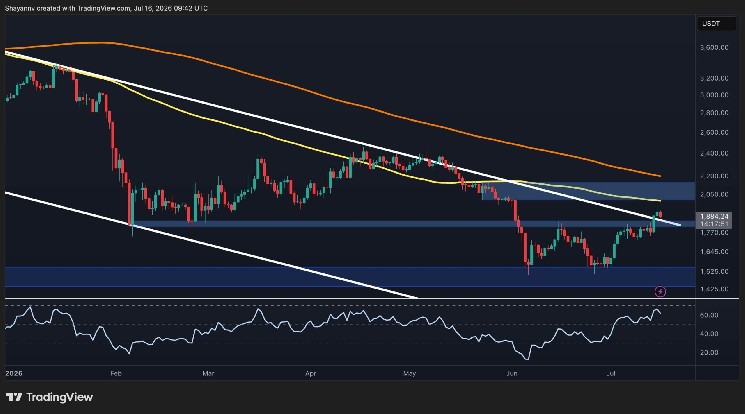
Ethereum has had a notable recovery from its June lows, reclaiming an important resistance zone while testing a major descending trendline on the higher timeframe. Although the latest rally has strengthened short-term sentiment, $ETH is still approaching a cluster of technical barriers that could determine whether the recovery extends above $2K or transitions into another corrective phase.
Ethereum Price Analysis: The Daily Chart
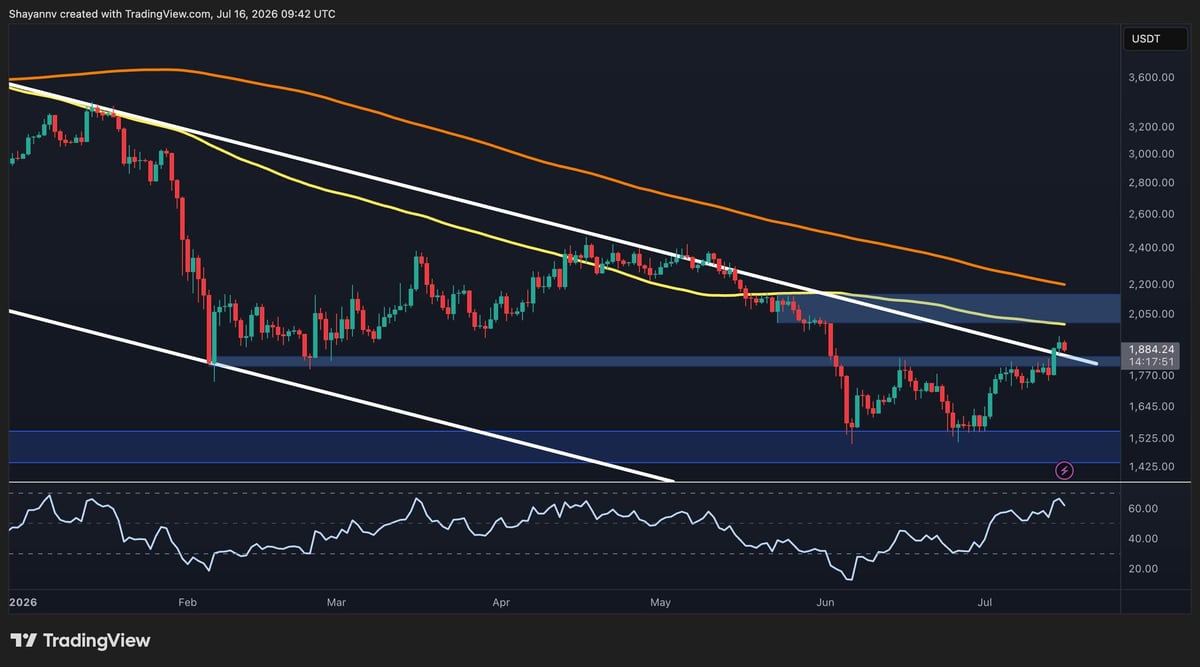
On the daily timeframe, $ETH has been trading within a broad descending channel that has defined price action for several months. The recent rebound from the $1.5K demand zone allowed the asset to reclaim the $1.8K support region.
The price is also on the verge of breaking above the channel’s upper boundary, which is closely followed by the descending 100-day moving average near the $2K area. This confluence has already attracted selling pressure, suggesting that sellers remain active around this technical barrier.
The next major resistance sits between $2K and $2.2K, where the 200-day moving average also converges from above. A confirmed breakout above the channel and a sustained move beyond $2.2K would represent a meaningful structural shift and could open the door toward higher recovery targets.
On the downside, the recently reclaimed $1.8K zone now acts as the first key support. Losing this level would once again expose the broader demand region around $1.5K, which previously triggered the latest bullish reversal.
$ETH/USDT 4-Hour Chart
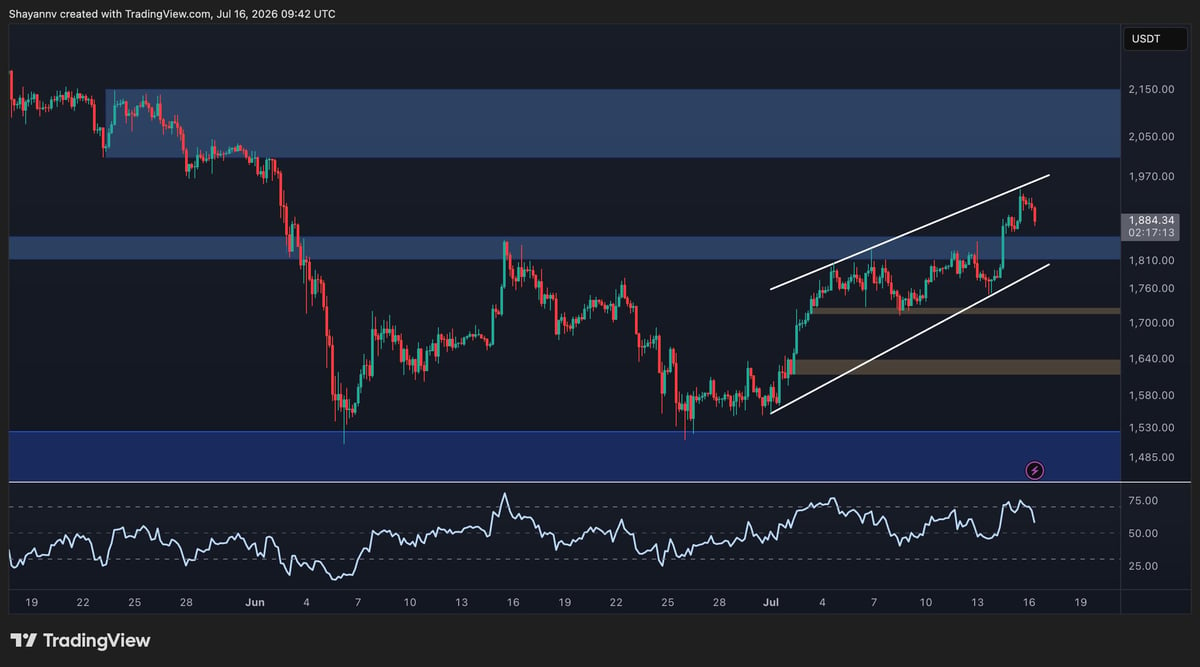
The lower timeframe shows a much stronger bullish structure. $ETH advanced inside a well-defined ascending channel after forming a clear double bottom near $1.5k and has been consistently printing higher highs and higher lows throughout the recovery.
The recent rally pushed the price above the $1.8K resistance zone before reaching the channel’s upper boundary around $1.95K. However, sellers defended this area, leading to a modest rejection from local highs.
As long as $ETH holds above the $1.8K breakout zone, the current pullback appears more consistent with profit-taking than a confirmed trend reversal. Maintaining this support could allow buyers to attempt another move toward the major daily resistance cluster between $2K and $2.2K.
Conversely, a decisive breakdown below $1.8K would weaken the short-term structure and could trigger a deeper retracement toward the intermediate support around $1.72K, or even the order block located around $1.62K to $1.64K, where buyers previously stepped in.
On-Chain Analysis
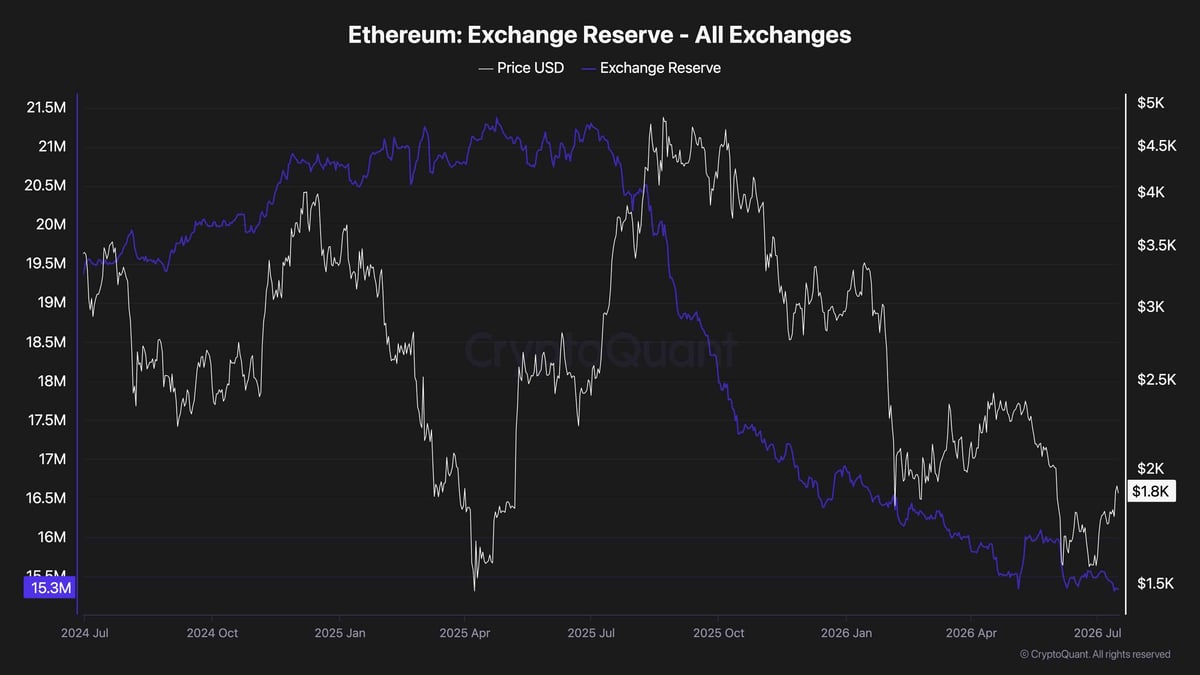
The Exchange Reserve chart continues to paint a constructive longer-term picture. Ethereum reserves held across centralized exchanges have declined steadily, reaching approximately 15.3 million $ETH, which is arguably the lowest reading over the past few years.
A persistent decline in exchange balances generally indicates that investors are withdrawing coins into self-custody or long-term storage rather than preparing to sell them immediately. This reduces the amount of readily available supply on exchanges and can provide a supportive backdrop if demand continues to recover.
While the falling exchange reserve does not guarantee immediate upside, the continued reduction in available supply complements the improving technical structure. If $ETH successfully clears the overhead resistance between $2K and $2.2K while exchange balances remain on their current downtrend, the broader recovery could gain additional strength. Conversely, failure to overcome the higher-timeframe resistance may still result in a short-term correction despite the favorable on-chain backdrop.

 ambcrypto.com
 en.bitcoinsistemi.com

 coinpedia.org

 coinfomania.com