

 2
2
Ethereum is drawing renewed attention as analysts point to long-term support structures that could shape its next major move.
Liquidity Hunter says bearish sentiment may be creating a contrarian opportunity, while Kamran Asghar says $ETH is retesting a historic trendline that previously marked a major bottom.
Ethereum Could Be the Market's Most Hated Opportunity, Analyst Says
Ethereum may be approaching a major turning point despite widespread bearish sentiment, according to crypto analyst Liquidity Hunter.
In a post on X, the analyst shared an inverted $ETH chart to highlight similarities between the current market structure and previous cycle bottoms. The chart suggests Ethereum is testing a long-term support area that has historically preceded significant trend reversals.
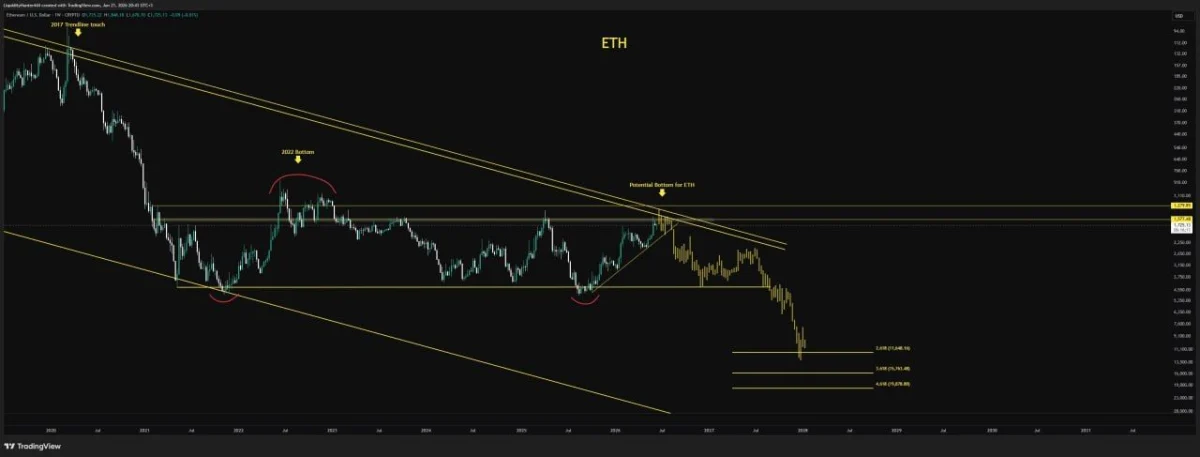
$ETH/USD Inverted Chart. Source: Liquidity Hunter (@LiqHunter)
According to the analysis, $ETH has spent several years consolidating within a broad range while repeatedly forming higher lows near key support zones. The chart also highlights a large descending trend line stretching back to previous cycle highs, with current price action positioned near a potential breakout area.
Liquidity Hunter argues that Ethereum's weak sentiment may be creating an opportunity rather than a warning sign. The analyst noted that $ETH has been widely criticized and overlooked in recent months, a condition that often appears near major market inflection points.
While the projected upside targets remain speculative, the chart suggests Ethereum could enter a stronger recovery phase if buyers successfully defend current support levels and reclaim long-term resistance.
For now, traders are watching whether Ethereum can maintain support and confirm a reversal structure, or whether bearish momentum continues to dominate the market.
Ethereum Retests Historic Trendline as Analyst Sees Potential Accumulation Zone
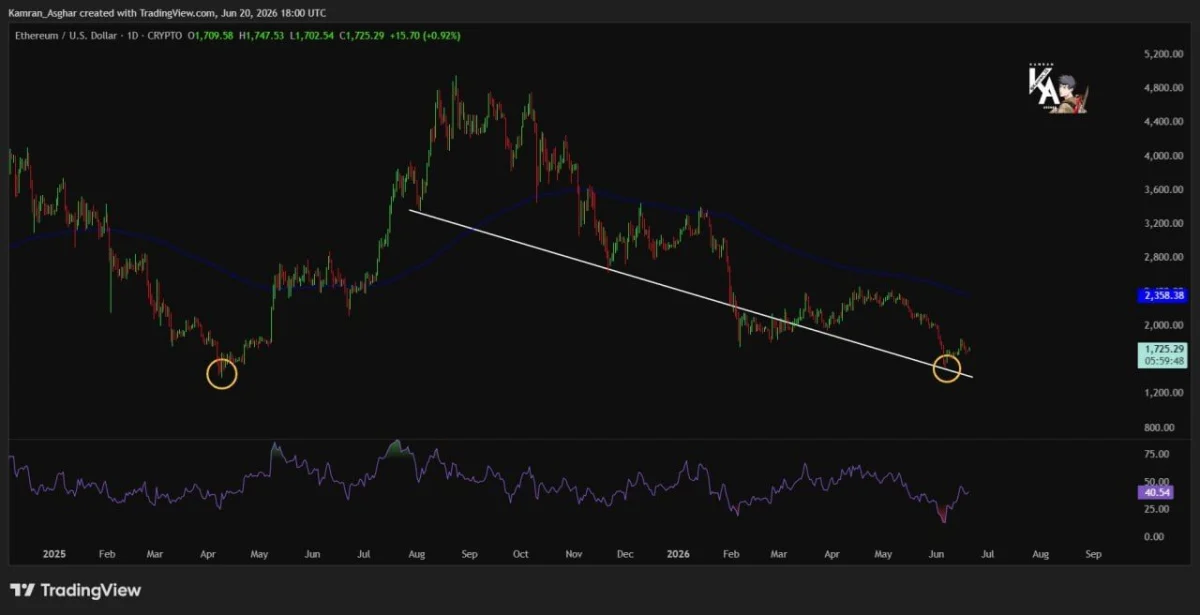
$ETH/USD Daily Descending Trendline Retest. Source: Kamran Asghar
Ethereum is testing a long-term descending trendline that previously coincided with a major market bottom, according to crypto analyst Kamran Asghar.
In a post on X, the analyst highlighted similarities between Ethereum's current price structure and the setup that formed before a significant reversal in early 2025. The chart shows $ETH returning to a falling trendline that has acted as a key technical reference point throughout the broader downtrend.
According to the chart, Ethereum is trading near $1,725 after revisiting the trendline support area. The highlighted circles mark previous instances where $ETH tested similar levels before staging a stronger recovery. The relative strength index (RSI) also appears to be recovering from oversold conditions, suggesting selling pressure may be easing.
Asghar argues that the current retest could represent a long-term accumulation zone if historical price behavior repeats. In that scenario, buyers could gradually return to the market and lay the foundation for a broader bullish reversal.
However, the setup remains unconfirmed. Ethereum would still need to establish higher lows and reclaim key resistance levels, including the 200-day moving average near $2,350, before a larger trend reversal can be validated.
For now, traders are watching whether the trendline support continues to hold or if Ethereum breaks lower and extends its corrective phase.

