


 16
16
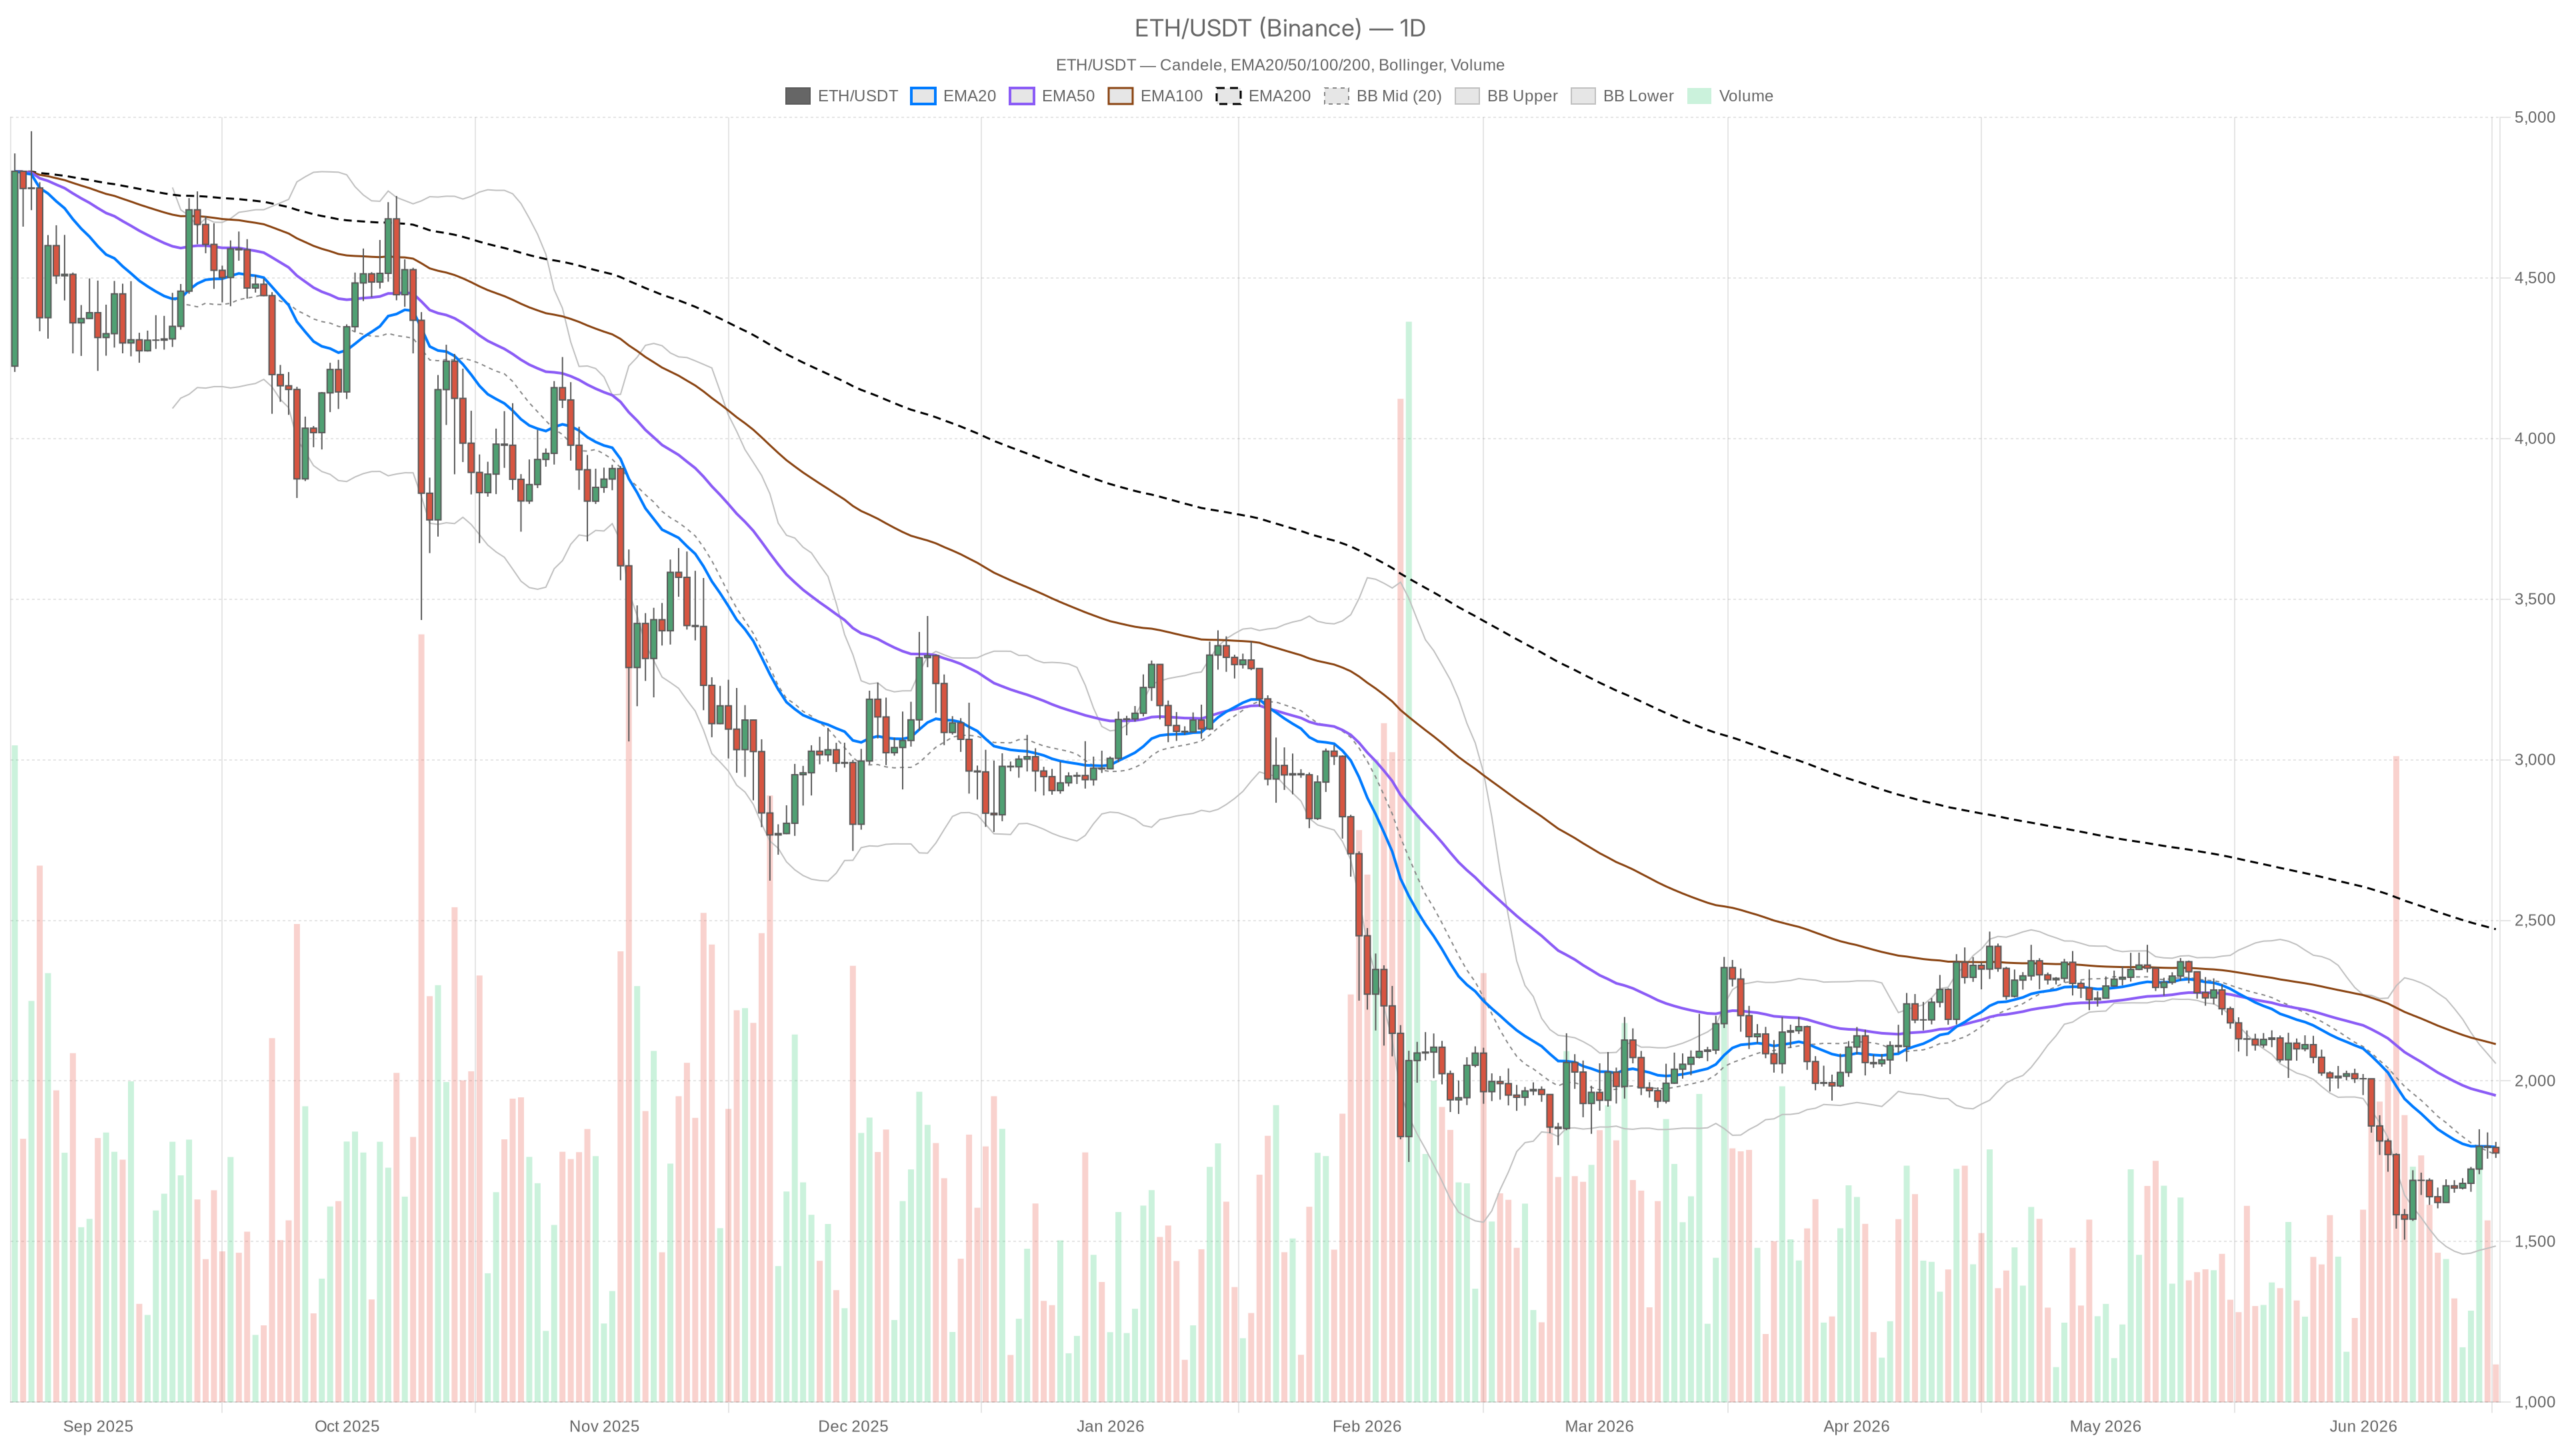
As of June 17, 2026, Ethereum is trading around $1,775, a level that defines the Ethereum price today with stark clarity. $ETH is not in freefall, yet it is not recovering either — it grinds sideways beneath declining moving averages while the broader market sheds nearly 2%.
Key takeaways
- $ETH trades at $1,775 with a daily RSI of 43.5, stuck below the 20-day EMA at $1,794.
- $BTC dominance at 56.2% and the Fear & Greed Index at 22 signal persistent risk aversion across crypto.
- The daily MACD histogram has turned positive, but the broader structure remains firmly bearish.
- A breakdown below $1,753 could open the path toward $1,486; a close above $1,794 is needed to shift the outlook.
The Daily Chart Is the Only Chart That Matters Right Now
On the daily timeframe, the regime is unambiguously bearish. Ethereum closed at $1,775.66, sitting below the 20-day EMA at $1,794 and the 50-day EMA at $1,954. The 200-day EMA, perched at $2,472, is structurally irrelevant for near-term action. Reaching it would require a genuine regime shift in market conditions. The price hovers near the lower portion of its daily Bollinger Band, with the lower band at $1,486, upper at $2,054, and midline at $1,770. Volatility is compressed, yet the directional lean remains downward.
The daily RSI at 43.5 is weak but not yet washed out. It sits in a no-man’s land between oversold and neutral — not low enough for mean-reversion buyers, not high enough for momentum. The MACD on the daily is still negative at -85.3, but the histogram has turned positive at +26.75. That divergence is the one mildly constructive signal on this timeframe. However, it simply means selling pressure is decelerating, not reversing.
Think of it as the market catching its breath rather than changing direction. The ATR of 93 points daily confirms this remains a wide, volatile instrument. One wrong move and you are looking at a $90+ candle in either direction.
Hourly Timeframe: Neutral, and That Is the Problem
Dropping to the 1-hour chart, the picture shifts to neutral — which may sound encouraging but is actually a warning. When the daily is bearish and the hourly goes neutral, the market is typically consolidating before another leg down. The 1H close is $1,775.63, just below the 20-EMA at $1,788 but right on the 50-EMA at $1,776. That hourly 50-EMA provides a thin floor, yet the 200-EMA at $1,720 reveals how far price has already fallen from its medium-term average.
The 1H RSI at 43.35 mirrors the daily almost exactly. Both timeframes read just below the midpoint, showing no conviction in either direction. The 1H MACD histogram has flipped negative at -3.44. In other words, short-term momentum has already rolled over. The hourly Bollinger Bands are tight between $1,772 and $1,808, with price sitting at the very low end. This is not a market setting up for a clean rally. It is deciding whether to consolidate here or break down through $1,772.
15-Minute Context: Execution Zone
The 15-minute chart reinforces the bearish lean without adding much new information. Price at $1,777 sits below the 20-EMA at $1,782 and the 50-EMA at $1,788. Moreover, all short-term momentum indicators point south. The MACD histogram on M15 is negative and deepening at -1.79, meaning even intraday bounces get sold immediately. The 15M pivot rests at $1,774, with R1 at $1,780 and S1 at $1,771. That is a genuinely tight range, suggesting the market is coiling.
For anyone watching for an entry, a push above $1,780 that fails to hold will be a false breakout. Meanwhile, a clean break below $1,771 likely accelerates toward the daily S1 at $1,753.
DeFi Activity: Volume Down, But Structure Holding
On-chain DeFi data from DefiLlama adds another dimension to consider. Uniswap V3 fees are down 21% in the last 24 hours, Uniswap V4 down 30%, and Fluid DEX dropped a steep 56% in a single day. In fact, these are not minor fluctuations — they signal a genuine pullback in on-chain trading volume. Reduced DEX activity correlates directly with lower demand for $ETH as gas and settlement currency.
That said, the 30-day trend for all major DEXs remains positive, with Uniswap V3 up 94% over that period. This daily drop therefore looks like short-term noise rather than structural deterioration. Still, it adds downward pressure on the narrative around Ethereum’s utility value.
The Bullish Case and What Would Make It Real
For Ethereum to flip constructive, the minimum requirement is a daily close above the 20-EMA at $1,794, ideally accompanied by rising volume. That level is only $18 away from the current price, which might sound easy. But $ETH has been failing at or below this level repeatedly, and each failed attempt reinforces the resistance.
A genuine recovery scenario would see price break above $1,803 — the daily R1 — and start building a base above the pivot at $1,782. If the daily MACD histogram continues improving and the RSI pushes back above 50, a move toward $1,950 to $2,000 becomes a realistic medium-term target.
What would invalidate the bearish thesis entirely? A sharp fear catalyst reversal — for instance, a macro risk-on shock or a major Ethereum-specific development — that drives a strong volume candle through $1,860 on the daily. At that point, the structure would change and the game would shift decisively.
The Bearish Case and Where It Leads
The bear case is already the base case according to the daily regime classification. A daily close below $1,753 — the daily S1 — would be the technical trigger that removes the floor from this consolidation. Below that, the next meaningful support is the lower Bollinger Band at $1,486, representing a $270 move from current levels. With an ATR of $93, that kind of decline could unfold over just a few sessions in a risk-off environment.
The Fear & Greed Index at 22 means the psychological conditions for a flush are already in place — all it takes is a catalyst. Furthermore, $BTC dominance at 56.2% continuing to rise would drain additional capital from $ETH and accelerate that scenario.
What would kill the bear case prematurely? A failure to break $1,753 on multiple tests, combined with the MACD histogram turning strongly positive and volume picking up on green candles. If sellers cannot push price lower despite these adverse conditions, the market is telling you something important.
How to Think About Positioning Here
This is not a market that rewards aggressive positioning in either direction right now. The daily is bearish, but the hourly and 15-minute are neutral — that timeframe disagreement is a volatility trap. Breakouts fail, breakdowns get bought back, and the net result is grinding chop that eats stop-losses from both sides. The ATR of $93 daily means position sizing must reflect the real range being covered, not the apparent calm of recent hours.
The Ethereum price today tells a story of a market caught between a bearish macro structure and decelerating sell-side momentum. Neither bulls nor bears have made a decisive move. The MACD histogram keeps recovery hopes alive, but it needs the daily RSI to confirm by crossing 50 before becoming actionable. Until then, the risk is asymmetrically toward the downside — and the market’s own fear reading at Extreme Fear 22 agrees. This is a moment for patience and clarity, not for forcing trades.
FAQ
What is $ETH trading at right now?
As of June 17, 2026, Ethereum is trading around $1,775, sitting below its 20-day EMA at $1,794 and well under the 50-day EMA at $1,954. The price has been consolidating in the lower half of a multi-month range with bearish daily structure.
What are the key support levels to watch for Ethereum?
The immediate support sits at $1,753, which is the daily S1 pivot level. A breakdown below this zone would likely target the lower Bollinger Band at $1,486 — a $270 move from current levels that could develop quickly given the $93 daily ATR.
What would turn the Ethereum outlook bullish?
A daily close above the 20-EMA at $1,794 with rising volume would mark the first constructive signal. For a genuine trend shift, price would need to break above $1,803 and build a base above $1,782, with the RSI climbing back above 50 and the MACD histogram continuing to improve.
Disclaimer: This article is for informational purposes only and does not constitute financial advice, an investment recommendation, or a solicitation to buy or sell any financial instrument or cryptocurrency. The analysis provided is not indicative of future results. Investing in crypto assets and financial markets carries a high risk of capital loss. Always do your own research (DYOR) and consult a qualified financial advisor before making any decision.
Article produced with the assistance of artificial intelligence and reviewed by the editorial team.

