


 18
18
Ethereum’s latest rebound remains corrective so far, with the price still trading below key supply zones after stabilizing near the lower support area. Further consolidation is expected for the coming week.
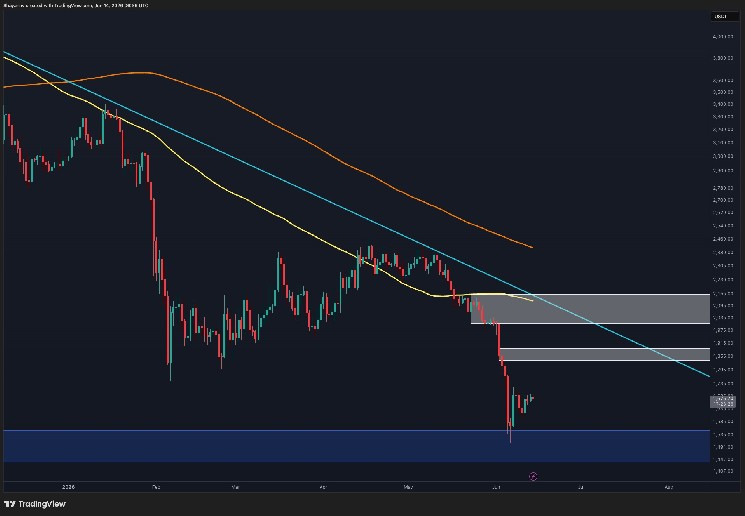
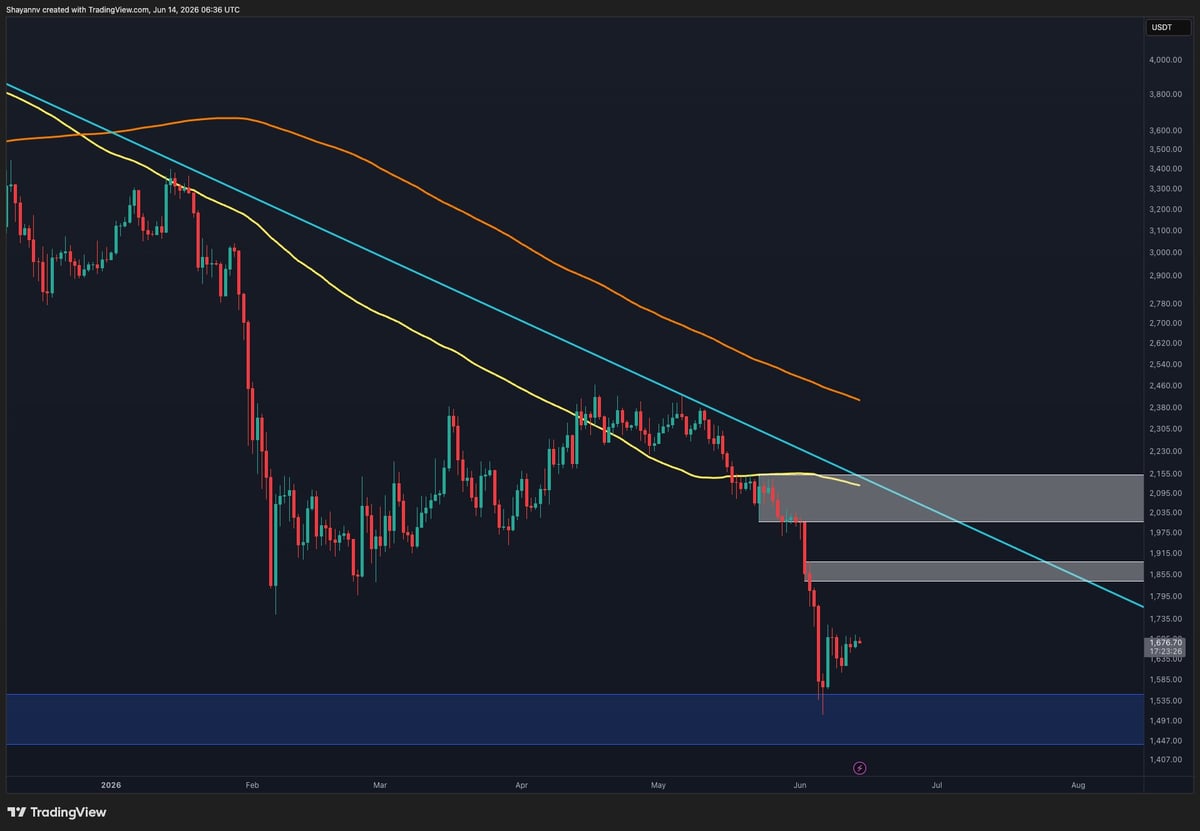
Ethereum Price Analysis: The Daily Chart
On the daily timeframe, $ETH is consolidating around $1.67K after reacting from the $1.5K support zone. The broader structure remains bearish, as the asset is still below the descending trendline and both major moving averages.
The nearest resistance sits around $1.85K to $1.9K, followed by the larger supply zone between $2K and $2.15K. A recovery into this area could face strong selling pressure, especially as it overlaps with the descending trendline. As long as $ETH remains below this region, the market structure favors consolidation or another rejection.
On the downside, the $1.5K zone remains the key support. Losing it could expose $ETH to deeper downside continuation.
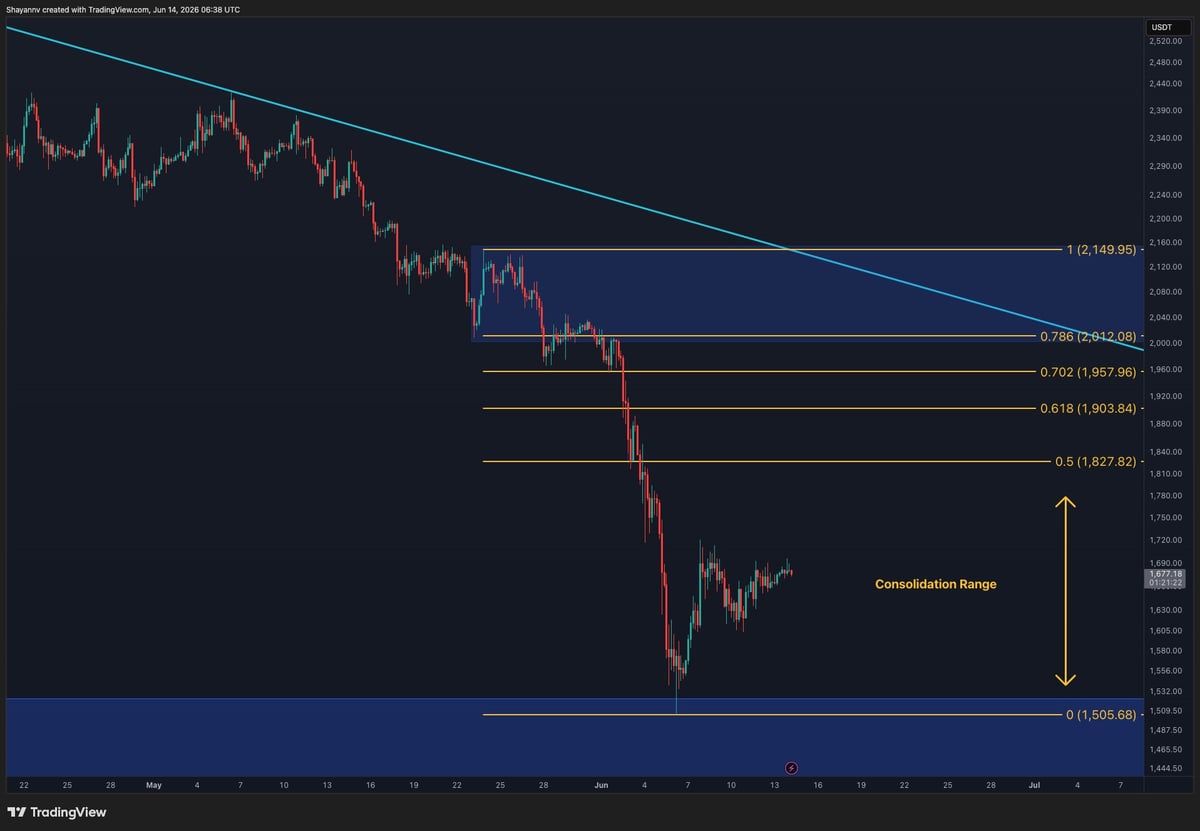
$ETH/USDT 4-Hour Chart
The 4-hour chart shows $ETH attempting to build a short-term base after the recent move into the $1.5K region. The asset is currently consolidating near $1.67K, while the marked Fibonacci retracement levels highlight potential recovery targets.
The first major upside area is around $1.83K, followed by $1.9K and $1.96K. A stronger rebound could push $ETH toward the $2K to $2.15K resistance zone, where the prior breakdown area and descending trendline may act as a major barrier.
However, unless price reclaims these levels with strength, the current move appears more like a corrective consolidation than a confirmed bullish reversal.
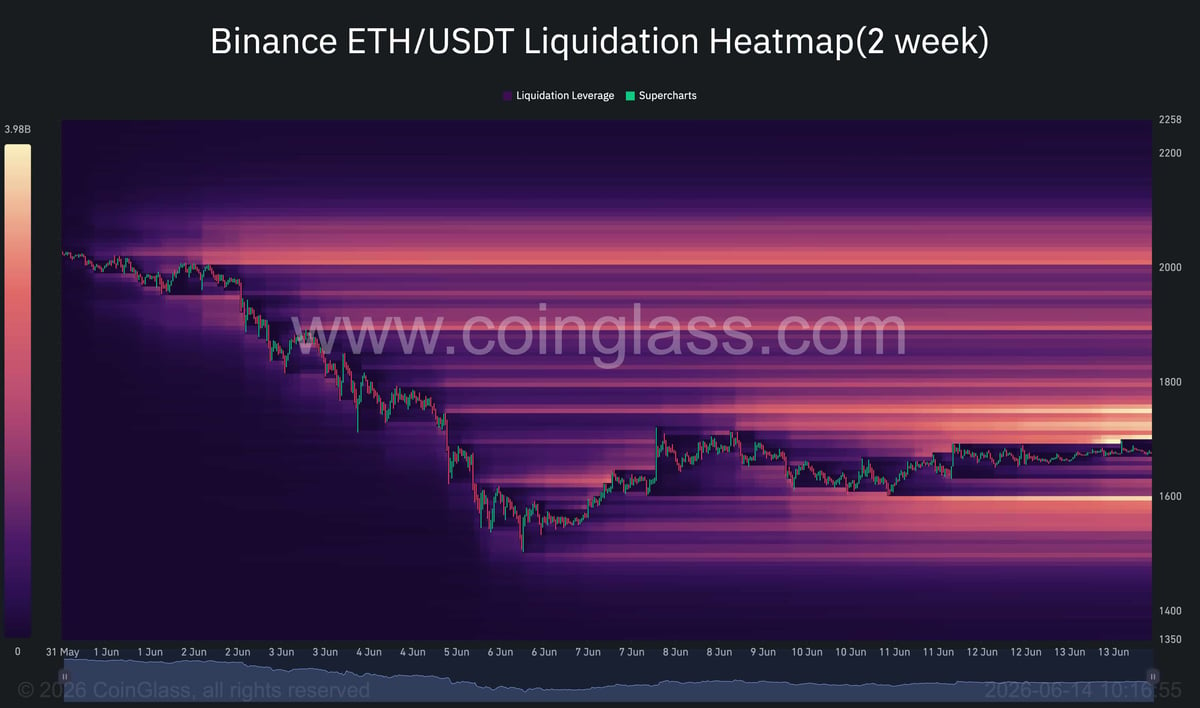
Sentiment Analysis
The Binance $ETH liquidation heatmap reveals a noticeable concentration of short liquidations above the current market price. The largest liquidity cluster is positioned around $1.75K to $1.8K, with additional pockets extending toward the $1.9K region and above $2K.
Since price is currently trading near $1.67K, these overhead liquidity pools could act as magnetic targets in the short term. A move into the $1.75K to $1.8K zone may trigger a wave of short liquidations, potentially accelerating momentum toward the $1.83K Fibonacci level.
At the same time, a significant liquidity pocket is also visible around the $1.55K to $1.6K region. If $ETH loses its current consolidation range, the market could revisit these lower levels before attempting another recovery.
Overall, the heatmap suggests that liquidity is currently skewed slightly to the upside, favoring a potential short squeeze toward $1.75K to $1.8K before the market decides whether a larger recovery toward the $1.9K to $2K resistance region is possible.