

 2
2
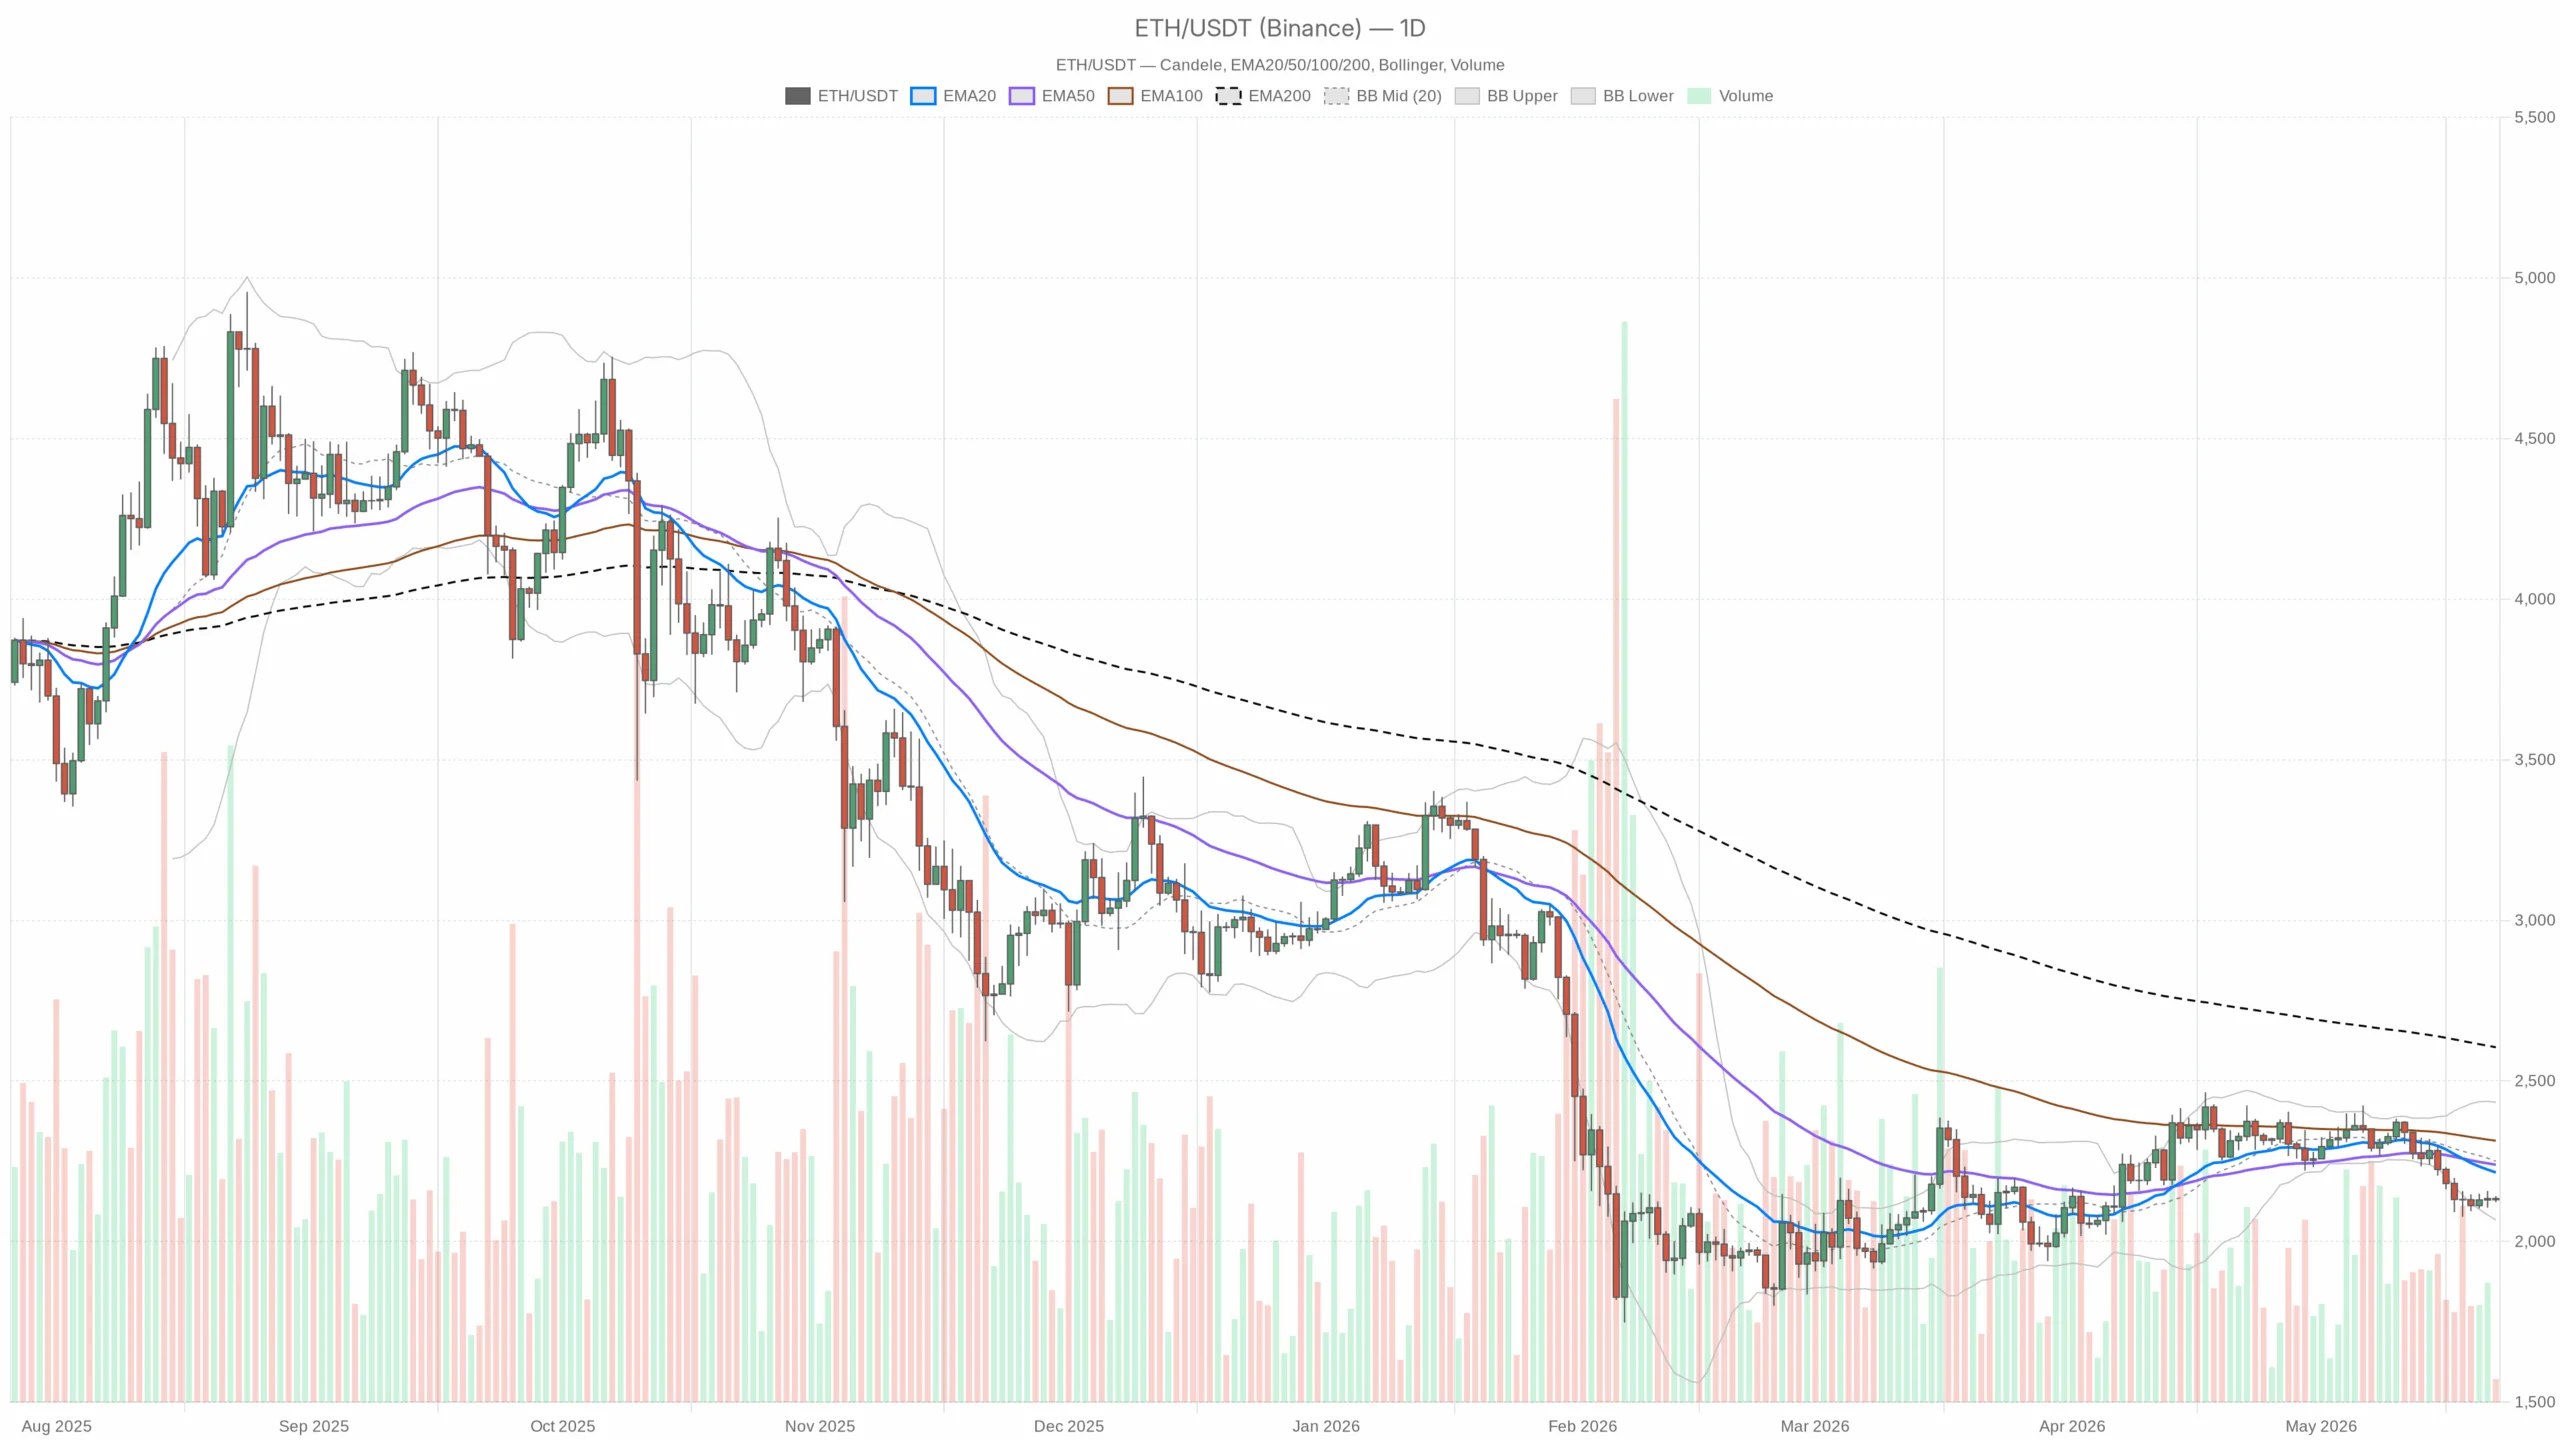
With risk-off tone and altcoins under pressure, the Ethereum price today hovers near 2,130 at the daily pivot as sellers cap bounces into 2,140–2,170.
Market logic across timeframes
Meanwhile, the tape is risk-off, with Bitcoin dominance ~58% and Fear & Greed at 28. Supply keeps arriving inside 2,140–2,170, while dip demand reacts near the lower Bollinger rail.
However, the daily structure is down, so mean-reversion rallies matter only if key moving averages are reclaimed. Until $ETH retakes the 20/50-day EMA cluster (2,215–2,239), the path of least resistance points toward the lower band and prior liquidity pockets.
Daily (macro bias = bearish): Trend dominates over mean reversion as momentum stays weak. Given the Ethereum price today is below all major EMAs, downside risk persists. The lower Bollinger Band near 2,067 is a magnet if 2,120 fails. Volatility is moderate, so breaks can travel a full day’s range.
1H (tone = neutral, softening the downside but not reversing it): Price is camped on the 20/50-hour EMAs near 2,132, with RSI mid-pack. That is balance, not strength. Bulls need acceptance above the 1H 200-EMA (~2,171) to argue for more than a bounce.
That said, 15m (execution context = neutral chop): Micro compression surrounds 2,130 with a flat MACD and tight bands. Breaks from 2,129–2,132 typically expand 8–12 points first; follow-through still depends on the 1H.
Indicator evidence (with plain-English reads)
Daily timeframe
- RSI(14): 36.7 — Weak, not oversold. Sellers have the ball, with room left before exhaustion.
- MACD: line -44.52, signal -25.66, hist -18.86 — Downside momentum persists; no bullish cross brewing yet.
- EMAs: 20D 2,215.05, 50D 2,238.97, 200D 2,604.79; price 2,130.28 — Price is below a bearish stack (20 < 50 < 200). Trend pressure is down.
- Bollinger Bands: mid 2,250.30, upper 2,433.57, lower 2,067.02 — Trading in the lower quartile; mean-reversion bounces can happen, but the mid-band is likely to cap first tests.
- ATR(14): 68.21 — Daily swings of roughly $70 are on the table; position sizing needs room.
- Pivot levels: PP 2,131.30, R1 2,140.37, S1 2,121.20 — Price is straddling the pivot; a slip under S1 often accelerates toward round numbers (2,110/2,100).
1H timeframe
- RSI(14): 48.89 — Balanced; neither side has momentum intraday.
- MACD: line -0.20, signal 0.51, hist -0.71 — Slight downside bias; rallies fade quickly.
- EMAs: 20H 2,131.82, 50H 2,131.59, 200H 2,171.31; price 2,130.28 — Pinched at 20/50H; the 200H above is the hurdle to change tone.
- Bollinger Bands: mid 2,132.39, upper 2,145.21, lower 2,119.56 — Range trade. A push through either band tends to run stops.
- ATR(14): 8.47 — Expect choppy $8–10 bursts; intraday stops must be tight or well-planned.
- Pivot levels: PP 2,129.87, R1 2,133.75, S1 2,126.40 — Micro battleground; losing S1 usually hands price to the lower band.
15m timeframe
- RSI(14): 46.82 — Slightly soft; momentum is tentative.
- MACD: line -1.30, signal -1.38, hist 0.08 — Flattening; coiled for a short move.
- EMAs: 20m 2,131.07, 50m 2,132.38, 200m 2,131.51; price 2,130.09 — All clustered; breakout pending.
- Bollinger Bands: mid 2,131.62, upper 2,139.23, lower 2,124.01 — Tightening bands signal an imminent expansion.
- ATR(14): 4.22 — Whippy micro-range; scalps can get chopped.
- Pivot levels: PP 2,130.84, R1 2,131.64, S1 2,129.28 — First mover above/below this 2,130 pocket often defines the next 10 points.
Scenarios
Bullish path (counter-trend for now): Hold above 2,121 (daily S1) and reclaim 2,140 (daily R1). Intraday acceptance above the 1H 200-EMA (~2,171) would open a squeeze into the 20/50-day EMA zone at 2,215–2,239. The daily mid-band near 2,250 is a stretch. Invalidation: a daily close back below 2,120, or repeated rejections at 2,140. A lower low under 2,119 hands control back to sellers.
Bearish path (main scenario): Failures into 2,140–2,170 roll back through 2,121 and 2,110 toward the daily lower band at ~2,067. If broader fear persists, an extension probe toward 2,000 cannot be ruled out, given the ~$70 daily ATR. Invalidation: a daily close above 2,215 (20-day EMA) and a sustained hold above ~2,171 on the 1H would neutralize the downtrend. That would force shorts to reassess.
Positioning and risk
For now, the tape rewards patience. With the daily trend down and intraday balance, respect the bearish bias until $ETH proves acceptance above 2,171 first, then 2,215–2,239. For bearish positioning, the cleaner spots are into 2,140–2,170 with risk defined against the 20-day EMA. For bullish positioning, let price earn it. A reclaim and hold above the 1H 200-EMA changes the game. Otherwise, treat bounces as rallies within a downtrend.
Moreover, volatility is live but not extreme (ATR ~68). Expect fakeouts around the 2,130 pivot and adjust size so a full day’s swing does not force decisions. Uncertainty remains high with a risk-off backdrop and heavy overhead supply. Plan entries around levels, predefine exits, and stay flexible if timeframes start to disagree.
Overall, the trend stays bearish while key moving averages cap rallies. Acceptance above the 1H 200-EMA and the 20/50-day cluster would shift tone; failure there keeps pressure toward prior lows and the lower band.