

 7
7
Ethereum ($ETH) price is stalling near $2,140 as a sharp DeFi erosion since January now matches a bearish chart structure carved out over the past seven weeks.
The lag against Bitcoin and a sliding holder cohort suggest the price weakness may be more than a routine pullback. The structure on the daily chart and the on-chain data tell the same story from different angles.
Ethereum Price Mirrors DeFi TVL Collapse Since January Peak
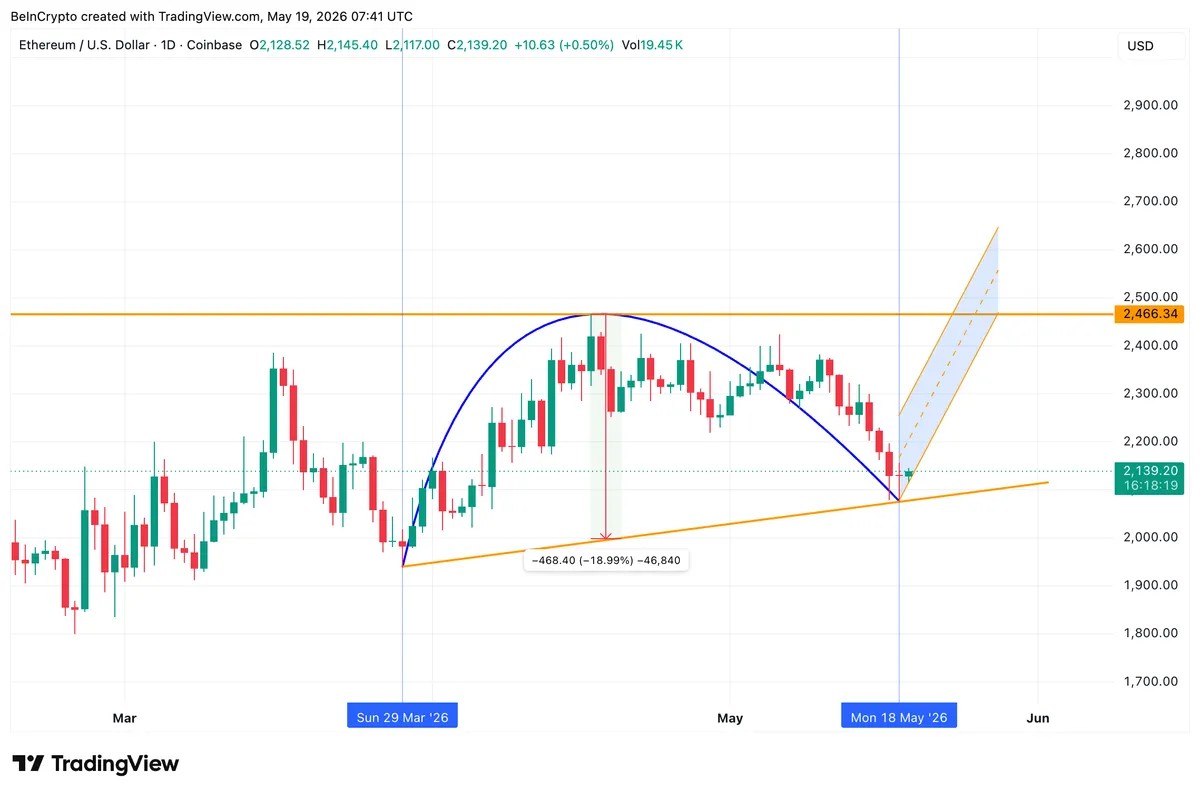
Ethereum has carved an inverted cup pattern on the daily chart between March 29 and May 18. The current rebound looks more like a handle of the inverted cup.
Want more token insights like this? Sign up for Editor Harsh Notariya’s Daily Crypto Newsletter here.
The formation is a bearish setup where price peaks in the middle of a rounded top and then forms a brief recovery handle. The pattern signals continuation lower if the cup’s neckline breaks.
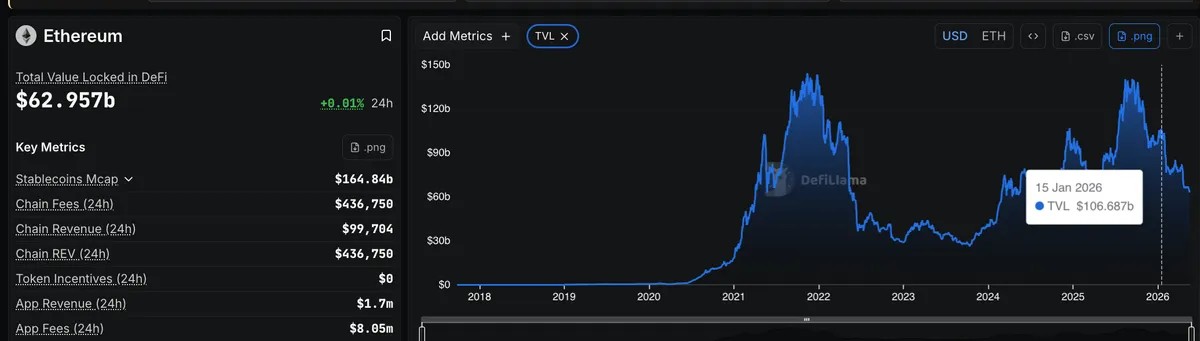
The price structure tracks the network’s deteriorating DeFi position. Ethereum DeFi TVL has fallen from $106.687 billion on January 15 to $62.957 billion as of May 18, a drop of nearly 41% in four months.
The damage extends into the same window that produced the bearish pattern. Around late March, just before the inverted cup began forming, the network’s DeFi TVL stood near $80.32 billion. It has shed roughly $17 billion since, mirroring the cup’s descent on the price chart. This fundamental erosion could be the reason why Bitcoin is up 2% month-on-month but $ETH is down 8%. That explains the 10% lag between the top two cryptocurrencies.
The handle now forming shows a brief bounce. Whether this rebound has legs depends on whether the underlying network activity stabilizes, or whether other holder cohorts confirm the same caution.
Mid-Term Holders Cut Stake as DeFi Stress Spreads
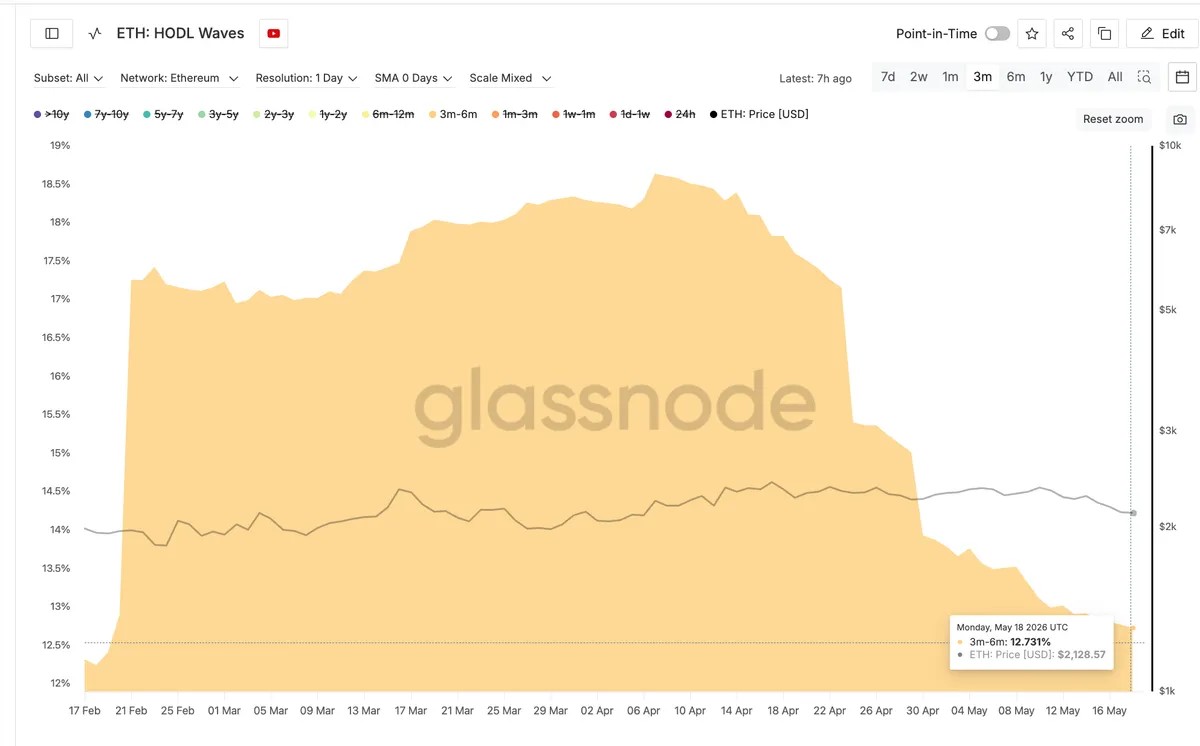
On-chain data from Glassnode reinforces the weakness. The HODL Waves indicator, a metric that tracks the share of Ethereum supply held across different age buckets, shows the 3-month to 6-month cohort has dropped sharply.
The cohort held 18.63% of total $ETH supply on April 7, when the inverted cup was still forming its right side. As of May 18, the same cohort holds just 12.73%, a roughly six-percentage-point decline in six weeks.
The drop matters because the 3m-6m bucket captures mid-term holders, often a steadier base than short-term speculators. Their decision to either spend $ETH or let them age out without rebuilding the bucket suggests possible loss of conviction, tied to the same DeFi erosion playing out across the network.
With both Ethereum DeFi TVL and a steady holder cohort sliding together, the case for a deeper move has built quietly underneath an $ETH price chart that still looks indecisive. The chart now becomes the decider.
Ethereum Price Levels That Decide the 19% Risk
Ethereum price needs to clear $2,132 immediately to keep the handle’s bounce alive. A break above $2,210, the 0.382 Fibonacci level drawn from the $1,799 swing low to the $2,464 swing high, would mark the first sign of returning strength.
The pattern only begins to weaken if $ETH reclaims $2,307. It is fully invalidated above $2,464, the prior peak that defines the cup’s rim.
On the downside, a failure at $2,132 exposes $2,087, the neckline of the formation. A daily close below $2,087 would confirm the breakdown.
The measured-move target then sits at $1,690. This level is roughly 19% below neckline and carries the full risk built up by the cup’s depth.
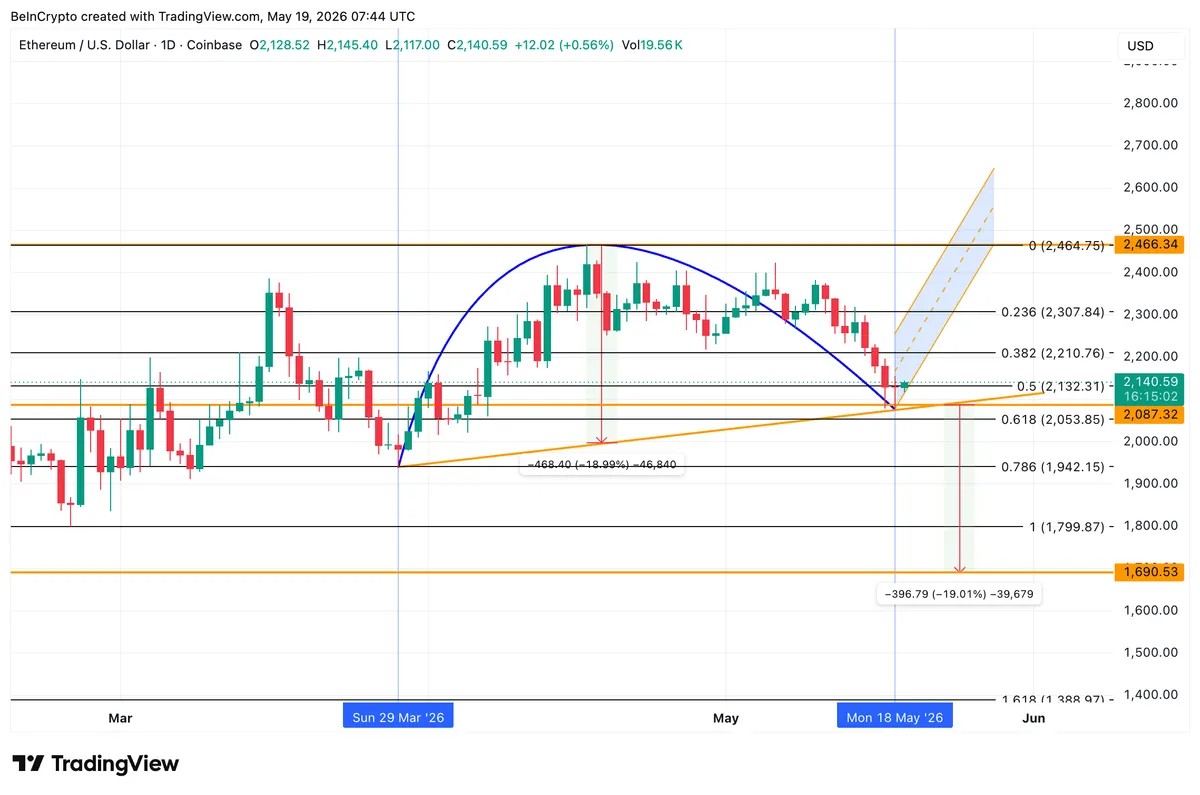
The pattern nuance worth flagging is that inverted cup and handle setups only confirm on a clean break below the neckline. Until that happens, the handle bounce remains in play. The $2,087 floor separates a recovery toward $2,210 from a measured slide toward $1,690.
The post Ethereum Price Slips 10% Behind Bitcoin as DeFi Engine Loses $43 Billion appeared first on BeInCrypto.

