

 5
5
Ethereum trades at $2,256 on May 15, down 5.5% in three days, as Santiment flags $74.58M in realized profits from wallets that bought during February’s sub-$2,000 lows and are now distributing into the dip while they still can.
$ETH Daily Chart: Lower Wedge Rail Is the Only Thing Holding This Together
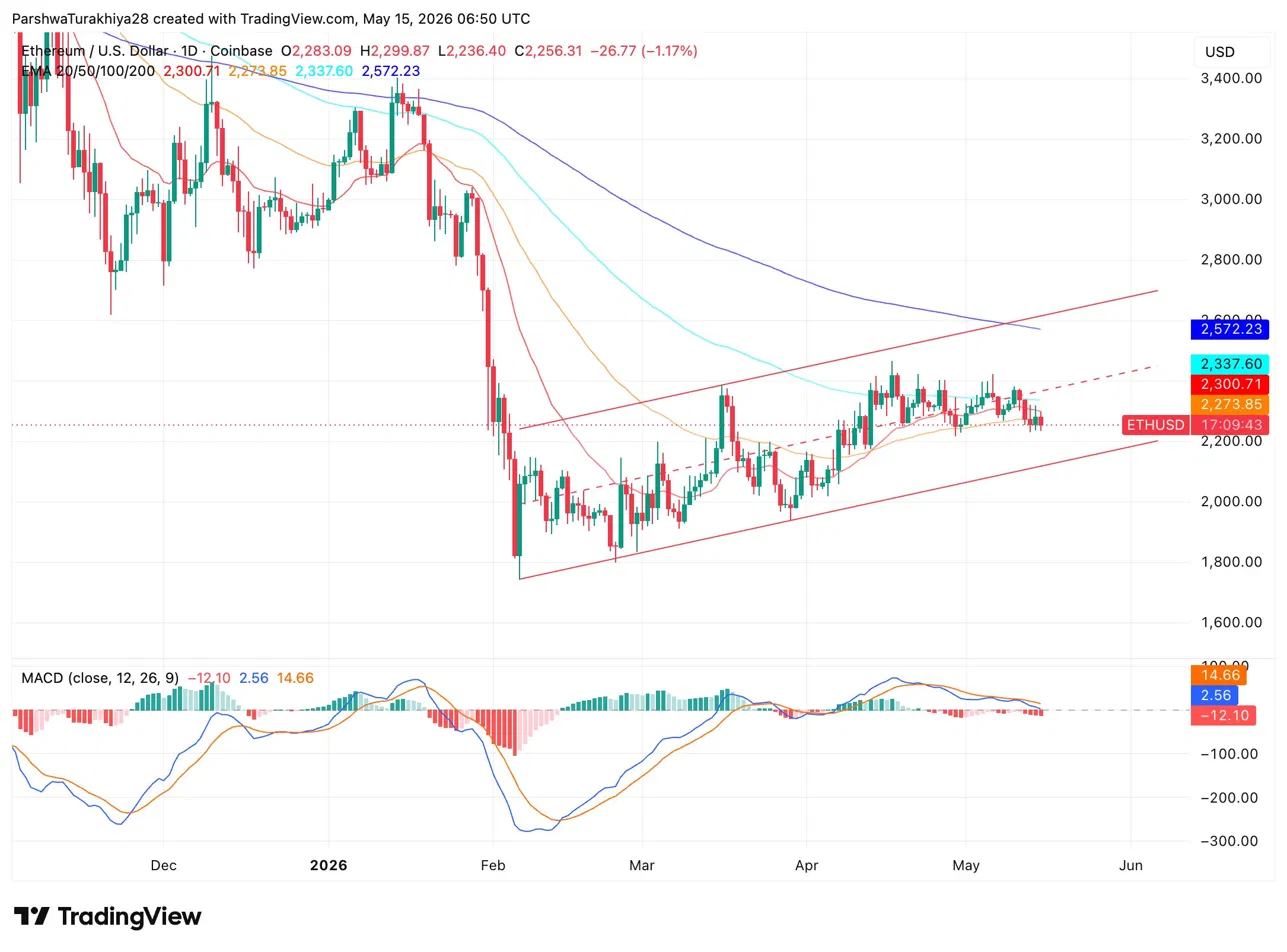
$ETH price is pressing the lower rail of the rising wedge near $2,236, the line that has defined $ETH’s recovery since the February low at $1,800. The 20 EMA at $2,300 and 50 EMA at $2,273 have both flipped back above price after acting as support through most of May. That is a near-term bearish shift and the first time both EMAs have been overhead simultaneously since early April.
The MACD crossed below its signal line with the histogram flipping negative at -12.10, the first bearish cross since early April. Overhead, the 100 EMA at $2,337 and 200 EMA at $2,572 are the levels that matter on any recovery attempt.
$ETH Key Levels For May 16:
- Resistance: $2,273 (50 EMA), $2,300 (20 EMA), $2,337 (100 EMA), $2,572 (200 EMA)
- Support: $2,236 lower wedge rail, $2,000 psychological, $1,800 February low
- MACD: Bearish cross confirmed, histogram at -12.10
Why $ETH Is Falling While Realized Profits Are Spiking
🤑 Ethereum just registered its highest network realized profits in 3 weeks. This may seem counterintuitive to see a spike of $74.58M in realized profits while $ETH’s price has dropped ~5.5% over the past 3 days. But here’s why:
— Santiment Intelligence (@SantimentData) May 14, 2026
📌 Holders with a much lower cost basis are… pic.twitter.com/YX6N6InkUX
Santiment recorded $74.58M in $ETH network realized profits on May 15, the highest reading in three weeks, during a 5.5% price drop. That looks contradictory until you look at who is selling.
Wallets that accumulated $ETH during February and March, when price sat below $2,000 amid war fears and peak uncertainty, are still sitting on gains even at $2,256. Those holders are choosing to sell into this dip rather than wait for a higher exit, treating the current level as a good enough opportunity.
Related: Shiba Inu Price Prediction: SHIB Burn Rate Explodes 1034% But Price Still Fails At $0.0000648
On-chain transaction volume spiked as price compressed near $2,241 on the 4H chart, which Santiment reads as distribution rather than panic. The guidance from Santiment is to lean cautious but not aggressively bearish. Realized losses expanding, not profits spiking, is the actual bottoming signal to watch for.
Four Straight ETF Outflow Days Tell the Same Story
$ETH spot ETFs recorded $5.65M in outflows on May 14, the fourth consecutive negative session. BlackRock’s ETHA led with $13.21M out, partially offset by Fidelity’s FETH at $6.88M in and VanEck’s ETHV at $3.37M in.
Combined, the four-day streak pulled over $156M out of $ETH spot products since May 11. Cumulative inflows still sit at $11.90B with total net assets at $13.45B, but the direction over the past week is clear.
$ETH Derivatives: Volume Up, Positions Closing
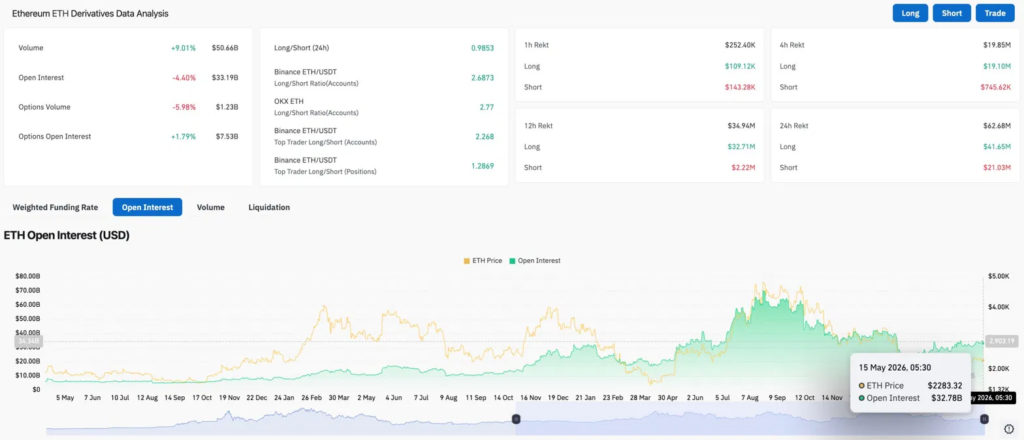
Volume rose 9.01% to $50.66B while open interest dropped 4.40% to $33.19B. Volume rising while OI falls means positions are being closed into the move, not new bets being placed. Retail on Binance holds a 2.6873 long ratio and OKX shows 2.77, both heavily long into a falling price.
Over 24 hours, longs absorbed $41.65M in liquidations against $21.03M for shorts. Longs are taking twice the pain, but the short liquidation figure is elevated enough to suggest some two-way volatility remains rather than a clean one-directional flush.
Ethereum Price Prediction: Upside and Downside for May 16
- Upside: Holding $2,236 on a daily close and MACD histogram stabilizing keeps the wedge intact. Reclaiming $2,273 flips the 50 EMA back to support. Realized profits compressing toward zero would signal the distribution phase is ending and give bulls a cleaner setup.
- Downside: Daily close below $2,236 breaks the wedge and opens $2,000. ETF outflows continuing into next week with the MACD histogram widening lower accelerates the drop. Realized losses beginning to spike would confirm the shift from distribution to capitulation.

