

 2
2
Ethereum is testing two breakout setups after pushing above key descending trendlines on daily and 6-hour charts. Analysts now point to $2,460 and $2,650 as the next major $ETH price targets if the breakout holds.
Ethereum Eyes $2,650 Target as $ETH Breaks Above Key Trendline
Ethereum traded near $2,379 on the daily $ETH/USD chart shared by More Crypto Online, while price moved above the descending orange trendline that had capped $ETH since the previous high area.
The chart shows $ETH recovering from the lower support zone near $1,600 to $1,821, where the move formed a larger corrective base. From that area, Ethereum built a rising structure marked as an A-B-C move, with price now testing the upper part of that recovery.
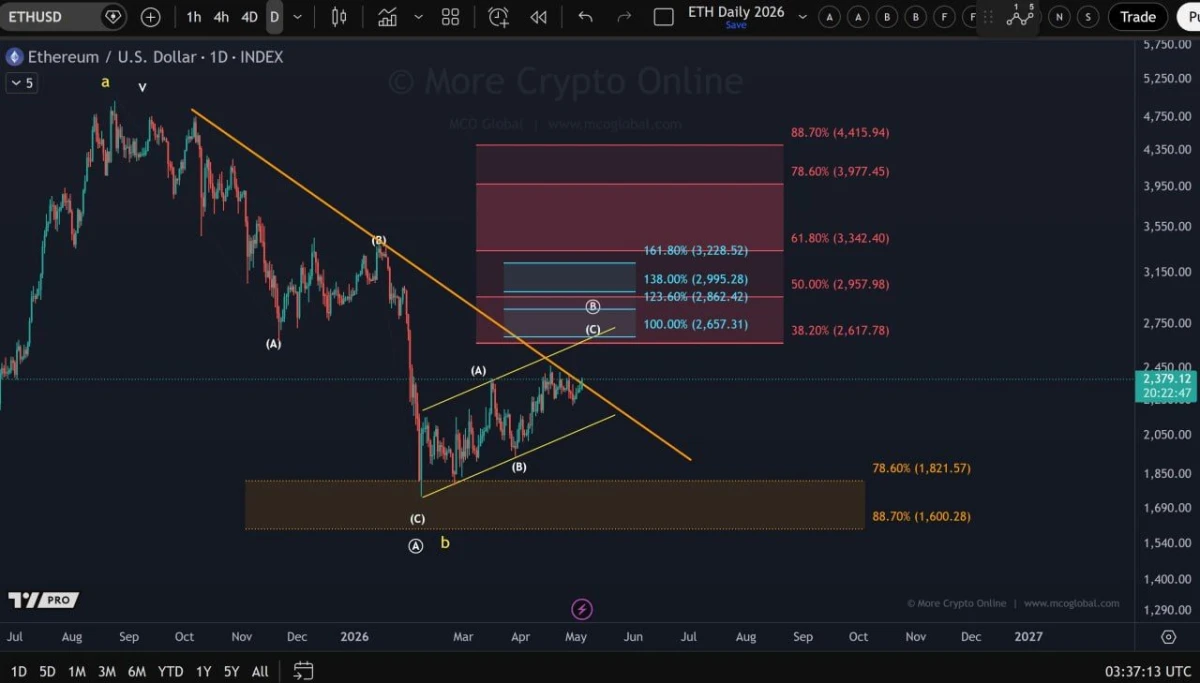
Ethereum Wave C Target Chart: Source: More Crypto Online on X
The analyst said the 100% extension target for wave (c) sits near $2,650. On the chart, this level appears at $2,657, which stands above the current price and inside the first marked upside target zone.
The breakout above the trendline matters because $ETH had failed several times near that same descending resistance. A daily move above it could confirm that buyers have gained short-term control after weeks of sideways and upward price action.
However, $ETH still needs to clear the next resistance area between $2,617 and $2,957. The chart marks this zone with Fibonacci levels, including the 38.2% retracement at $2,617 and the 50% retracement near $2,958.
If $ETH holds above the broken trendline, the next upside levels remain $2,650, $2,862, and $2,995. A stronger move could later bring the $3,228 extension into focus.
If $ETH falls back below the trendline, the breakout would weaken. In that case, price could revisit the rising yellow support structure near the lower part of the current channel. A deeper failure could bring the $1,821 to $1,600 support zone back into view.
For now, the chart shows Ethereum attempting a breakout, with $2,650 as the main short-term target. The next confirmation depends on whether $ETH can stay above the trendline and move into the marked resistance zone.
Ethereum Tests Breakout as Chart Points to $2,460 Target
Ethereum traded near $2,341 on the 6-hour $ETH/USDT chart shared by The Cryptomist, while price pushed above a short descending trendline on Binance.
The chart shows $ETH moving sideways under the trendline after its April rally. Price made several lower highs from the area near $2,460, then dropped toward the $2,220 to $2,260 zone before recovering in early May.
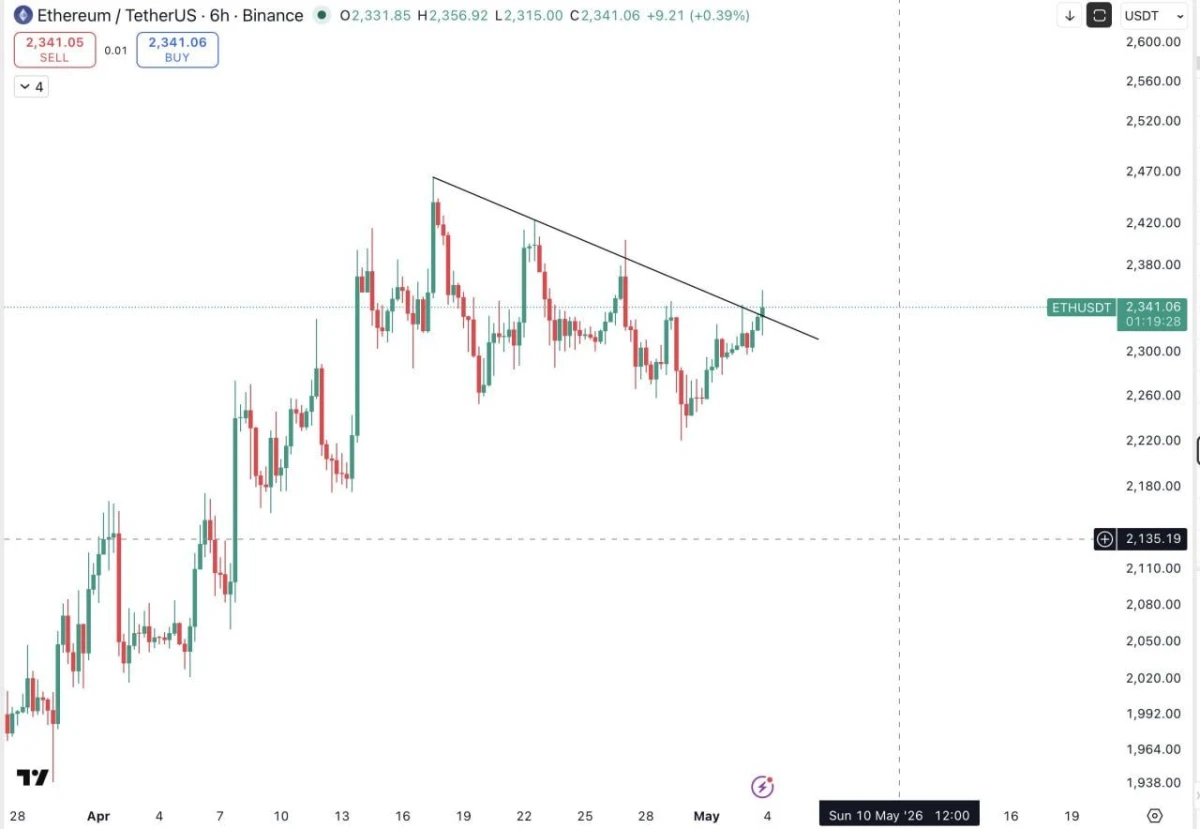
Ethereum Weekly Breakout Retest Chart. Source: The Cryptomist on X
$ETH is now testing the upper edge of that structure. The move above the trendline suggests buyers are trying to confirm a breakout after days of compression.
The Cryptomist said Ethereum is attempting a weekly close breakout. The setup idea is to enter long positions on a retest, not at the first breakout candle.
That means the broken trendline may become support if $ETH pulls back and holds above it. A successful retest would strengthen the breakout case and keep the $2,460 target active.
However, a failed retest would weaken the setup. If $ETH falls back below the trendline, price could return to the recent range near $2,300 and then the lower support zone around $2,220 to $2,260.
For now, the chart shows $ETH at a decision point. Holding above the breakout area keeps the bullish structure alive, while losing it would show that the move has not confirmed yet.