


 5
5
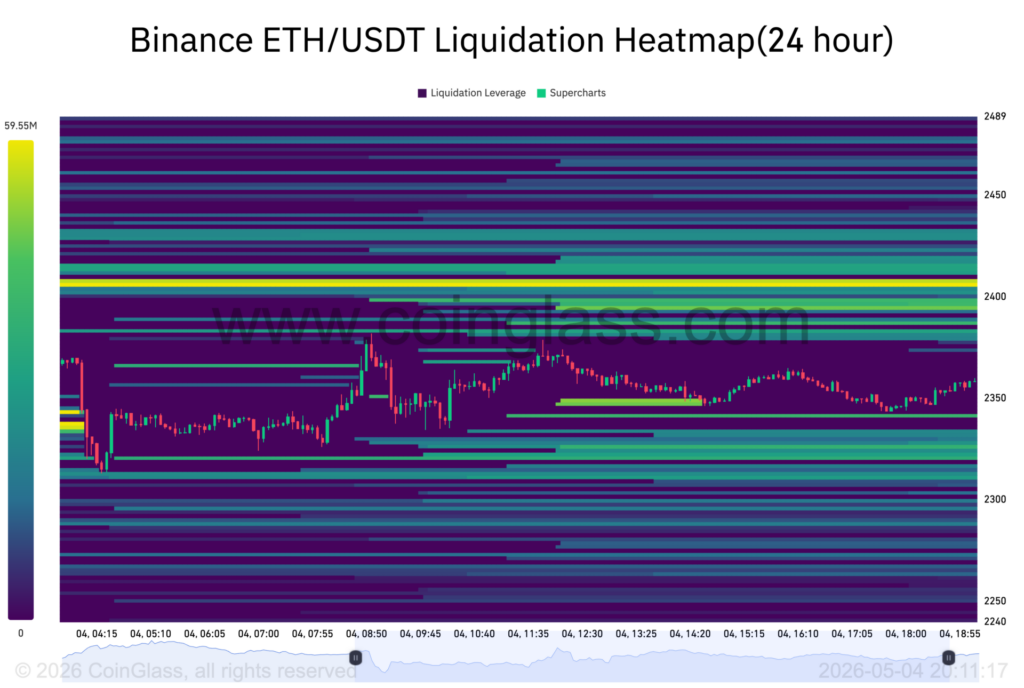
Ethereum is trading in a narrow range, but derivatives positioning suggests the market is far from calm underneath. CoinGlass data shows roughly $874 million in long positions face liquidation below $2,206, while $403 million in shorts face liquidation above $2,412.
The 24-hour realized liquidation picture skews bullish. Total forced closures reached approximately $33 million, with shorts accounting for $25.93 million and longs only $7 million, per CoinGlass.
Whales bought 140,000 $ETH while price held
Santiment data shows large holders accumulated more than 140,000 $ETH between May 1 and May 3, worth roughly $322 million, shared by Ali Martinez. Whale balances moved from 13.83 million $ETH to 13.98 million $ETH over the window.
Whales have gone on a buying spree, accumulating over 140,000 Ethereum $ETH in the last 96 hours, worth around $322 million. pic.twitter.com/uHZqV3B0W9
— Ali Charts (@alicharts) May 3, 2026
CryptoQuant order-size data adds texture worth paying attention to. Whale buys clustered at $2,005 to $2,100 in early April, then migrated to $2,250 to $2,300 by late April.
On May 2, the largest single spot buy was 556 $ETH at $2,316. Whales accumulated on the way up, not on weakness, which is the kind of detail that changes how you read the bid.
ETF flows turned positive after a rough week
Institutional flows turned positive again on May 1 after four straight days of outflows. Spot Ethereum ETFs recorded net inflows of $101.2 million per Farside Investors, with the bulk concentrated in two funds.
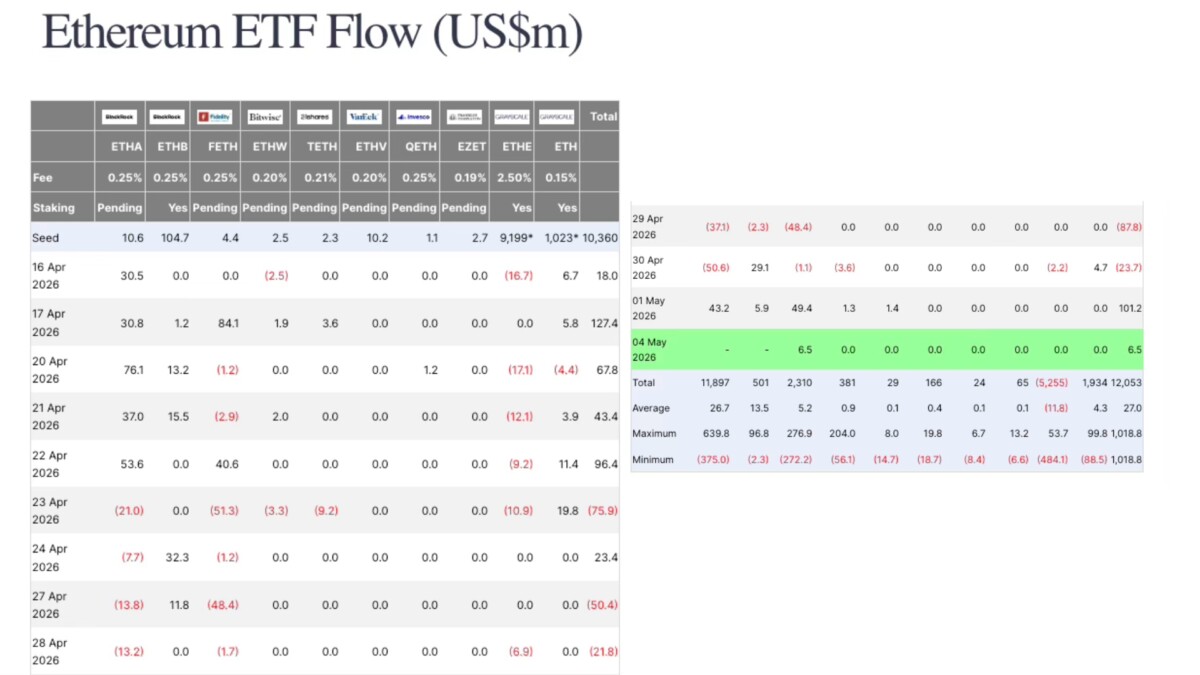
BlackRock’s ETHA pulled in $43.2 million. Fidelity’s FETH added $49.4 million. Other issuers had smaller, mixed flows.
$2,400 is the ceiling, but $ETH/$BTC is the bigger tell
Order book data shows dense sell-side liquidity between $2,350 and $2,500, which is why $2,400 has functioned as resistance. Analyst Ted Pillows put it bluntly: “$ETH is still going sideways” until $2,400 is reclaimed.
The contrarian signal worth watching is the $ETH/$BTC ratio, currently around 0.0294. Michaël van de Poppe identified 0.032 as the breakout threshold. “If it clearly breaks 0.032 $BTC, that’s where the party starts,” he wrote on X.
The ratio matters because whale accumulation in dollar terms can coexist with $ETH continuing to underperform Bitcoin if cycle dominance hasn’t shifted yet.
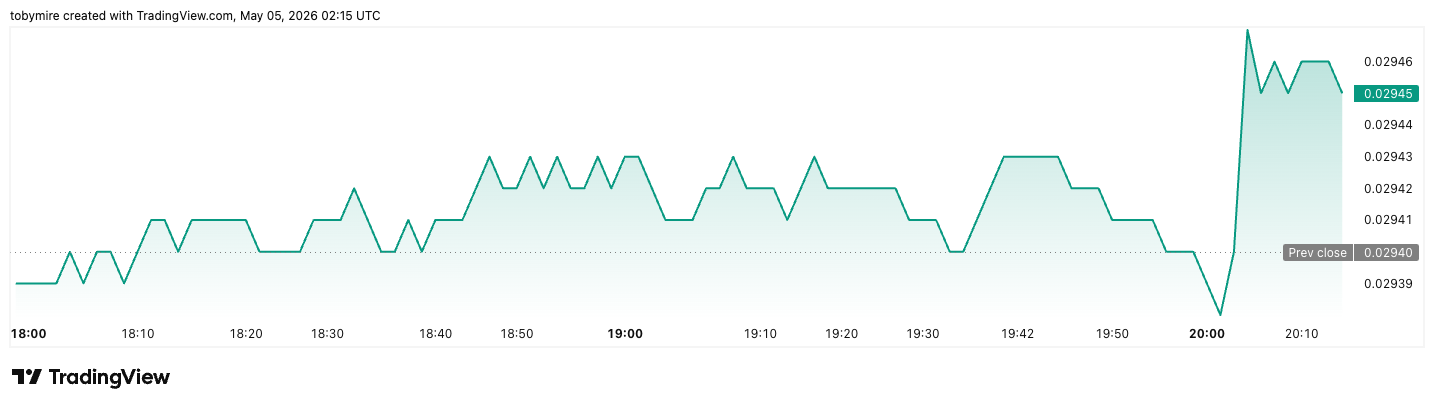
The ratio matters because whale accumulation in dollar terms can coexist with $ETH continuing to underperform Bitcoin if cycle dominance hasn’t shifted yet.
Cryptopolitan reported earlier that $ETH built higher lows from $1,840 to $2,450 through March and April before pulling back, with the technical structure described as recovering but fragile.
Why the compression matters
Open interest sits around $30 billion, with $ETH-specific 24-hour futures volume near $18 billion, while spot volume is under $1 billion. That ratio is what makes the setup unstable. Leverage is building faster than spot demand can resolve direction.
A clean break above $2,412 or below $2,206 would force liquidations that could amplify the move in whichever direction breaks first.
Until one of those levels gives, positioning rather than spot demand is what’s setting price.