


 5
5
$ETH is trading at a key decision point, with charts showing resistance between $2,290 and $2,365 and a median range level that bulls need to hold as support. A clean move above resistance could open the way toward the upper range, while a failed support flip may send $ETH back toward lower levels.
$ETH Price Tests First Resistance Zone as Weekend Range Takes Shape
$ETH is testing its first short-term resistance zone between $2,290 and $2,365, according to the 1-hour $ETH/USD chart shared by MCO Global DE.
The chart shows $ETH recovering from this week’s low, but MCO Global DE said the move still appears to be a three-part structure. That means the bounce has not yet confirmed a stronger impulsive breakout.
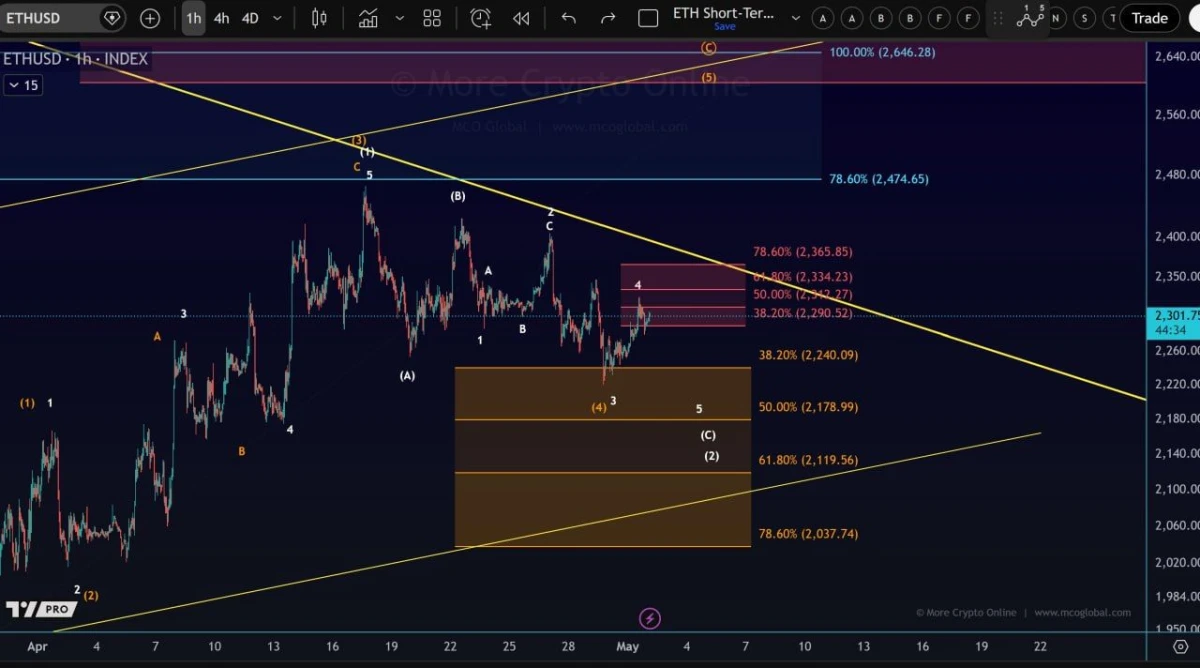
$ETH Weekend Resistance Zone. Source: MCO Global DE
The red resistance box sits around the key Fibonacci levels marked on the chart. These include the 38.2% level near $2,290, the 50% level near $2,312, the 61.8% level near $2,334, and the 78.6% level near $2,365.
For the weekend, this zone remains the main area to watch. MCO Global DE said $ETH will likely stay inside or below this resistance area during the weekend.
If $ETH breaks above $2,365, the chart points toward the descending yellow trendline as the next major test. That trendline has capped the wider structure and still acts as overhead resistance.
However, if $ETH fails to hold the current bounce, the lower support area remains important. The chart marks downside Fibonacci levels near $2,240, $2,178, $2,119, and $2,037.
$ETH Price Reaches Critical Median Range as Bulls Need Support Flip
$ETH is sitting near a key mid-range level on the 2-hour $ETH/USD chart shared by Castillo Trading.
The chart shows $ETH testing the Median ML area around the middle of the range. Castillo Trading said $ETH needs to turn this level into real support to open a move toward premium prices and the upper limit.
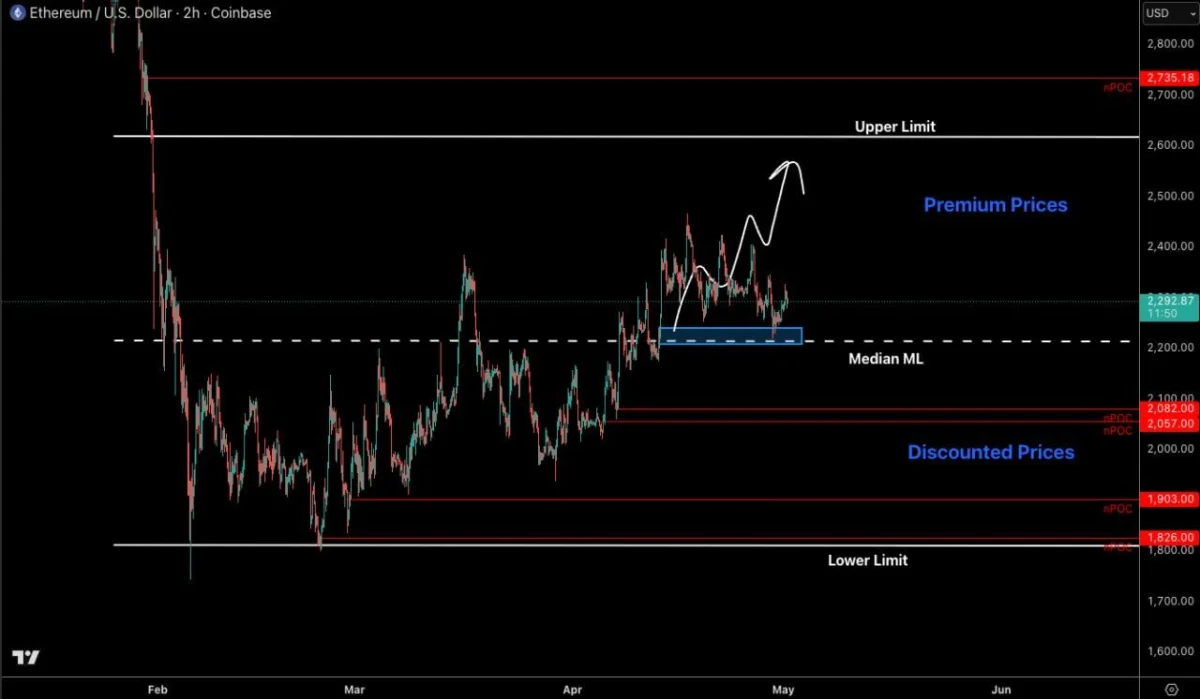
$ETH Median Range Test. Source: Castillo Trading
The blue support box sits near the median area, while price is trying to hold above it. If buyers defend this zone, $ETH could bounce toward the upper part of the range.
The chart marks premium territory above the median, with the upper limit sitting near the $2,600 area. A stronger move could then target the red nPOC level near $2,735.
However, $ETH remains at a decision point. If price loses the median level, the chart suggests a move back toward the lower range becomes more likely.
The downside levels include the red nPOC areas near $2,082, $2,057, $1,903, and $1,826. The lower limit sits near the $1,800 zone.