


 19
19
Ethereum is trading around $2,460 as it holds near its highest levels since the February breakdown, with the broader crypto market continuing to recover. $ETH is now pressing against one of the most technically significant zones of the entire correction.
How the price behaves over the next several sessions will go a long way toward determining whether this rally has genuine legs or simply represents another failed attempt at trend reversal.
Ethereum Price Analysis: The Daily Chart
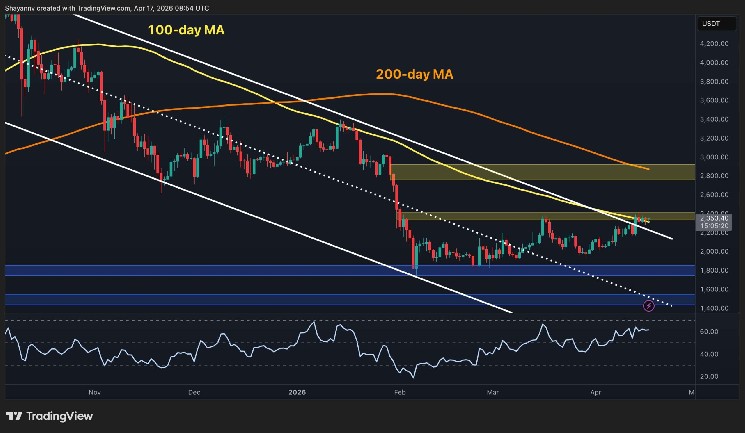
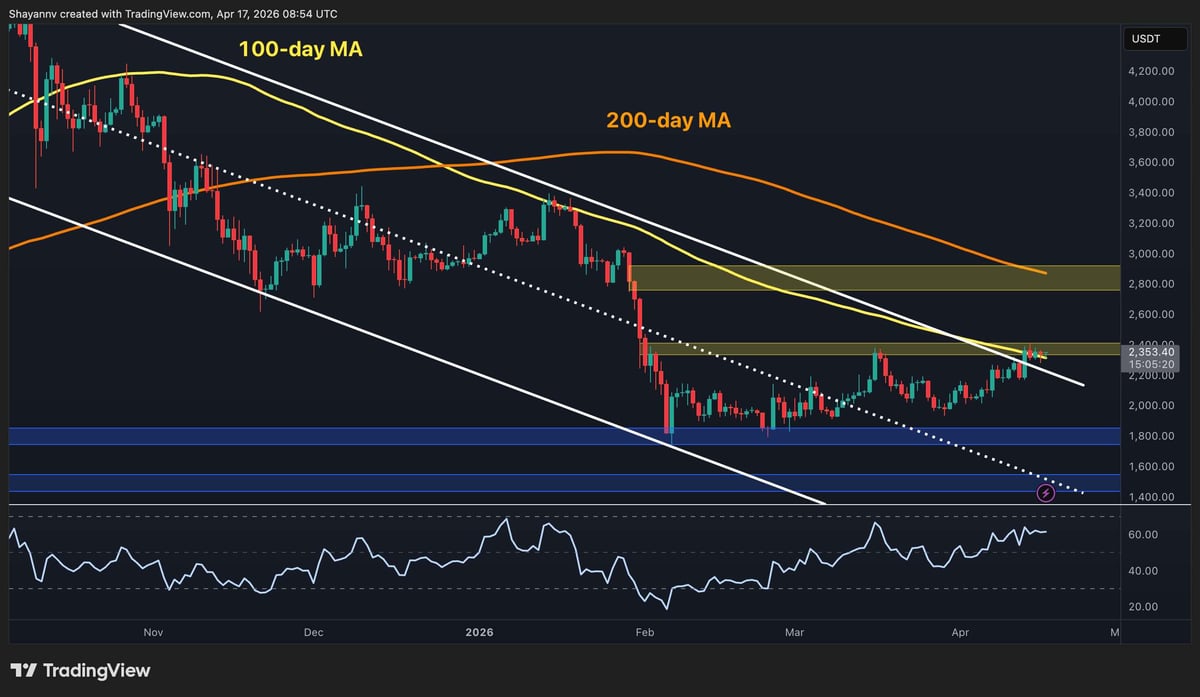
$ETH has broken slightly above the long-term descending channel’s upper boundary on the daily chart and is now testing the 100-day MA near and the horizontal $2.4k supply zone. This is a very important level that has stood firmly over the past couple of months. The RSI has also climbed into the high-50s and is trending upward. This indicates that momentum supports the breakout attempt and is not flashing an overextended signal yet.
The key test now is whether $ETH can convert this into a valid breakout above the $2.4k level and the 100-day moving average. The $2.8k zone above represents the next major supply corridor, with the declining 200-day MA (~$2.9k) located at its upper boundary.
A daily candle close above $2.4k would be the most bullish development in months, and could pave the way toward $2.8k. On the other hand, if the market fails to continue higher, a drop back inside the descending channel would be likely, which could then result in another decline toward the $1.8k critical support area.
$ETH/USDT 4-Hour Chart
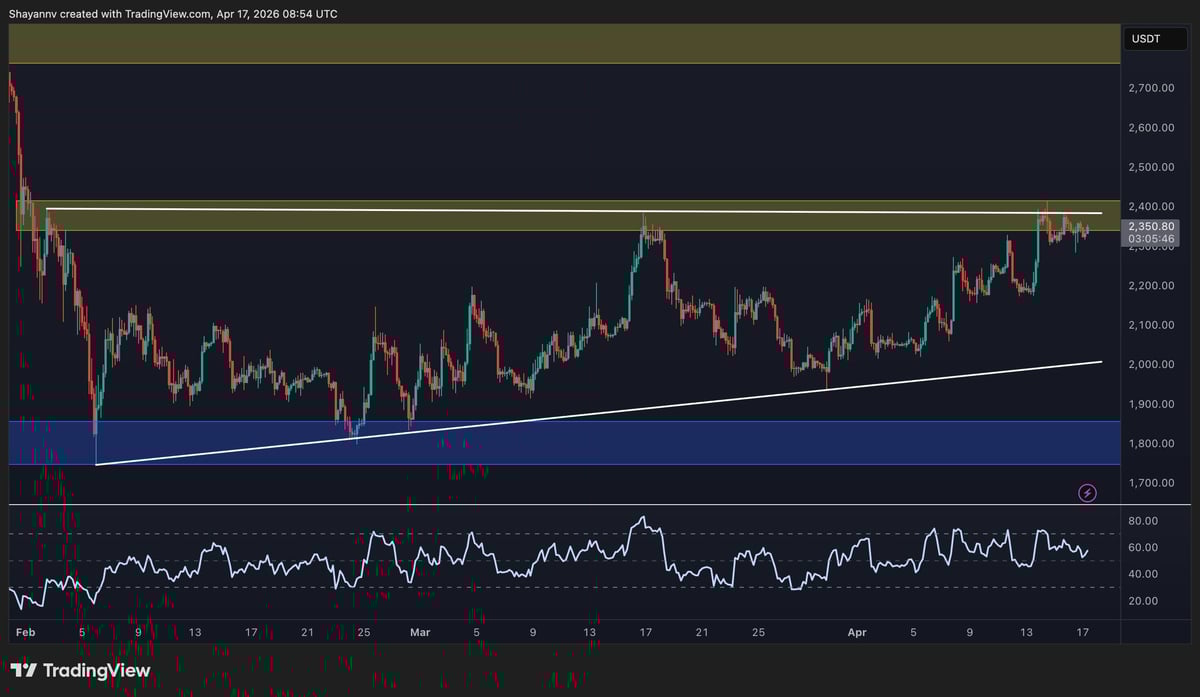
On the 4-hour chart, $ETH has been grinding just below the $2.3k–$2.4k resistance band for the past several sessions. Meanwhile, the ascending trendline from the February lows continues to provide a rising floor, which is currently located near the $2k mark. The most recent push briefly broke above the $2.4k level before pulling back modestly, and the price is currently consolidating above $2.4k, which is directly inside the resistance zone.
The RSI on this timeframe is also hovering in the mid-60s, which is elevated but not overbought, but has pulled back from overbought levels in recent days. The pattern of steep higher lows on the 4-hour chart since early April is also constructive and contrasts with the repeated failed recoveries seen in March. Therefore, all eyes are now on the $2.4k resistance zone, which a breakout from would indicate that Ethereum is serious in its recovery.
Sentiment Analysis
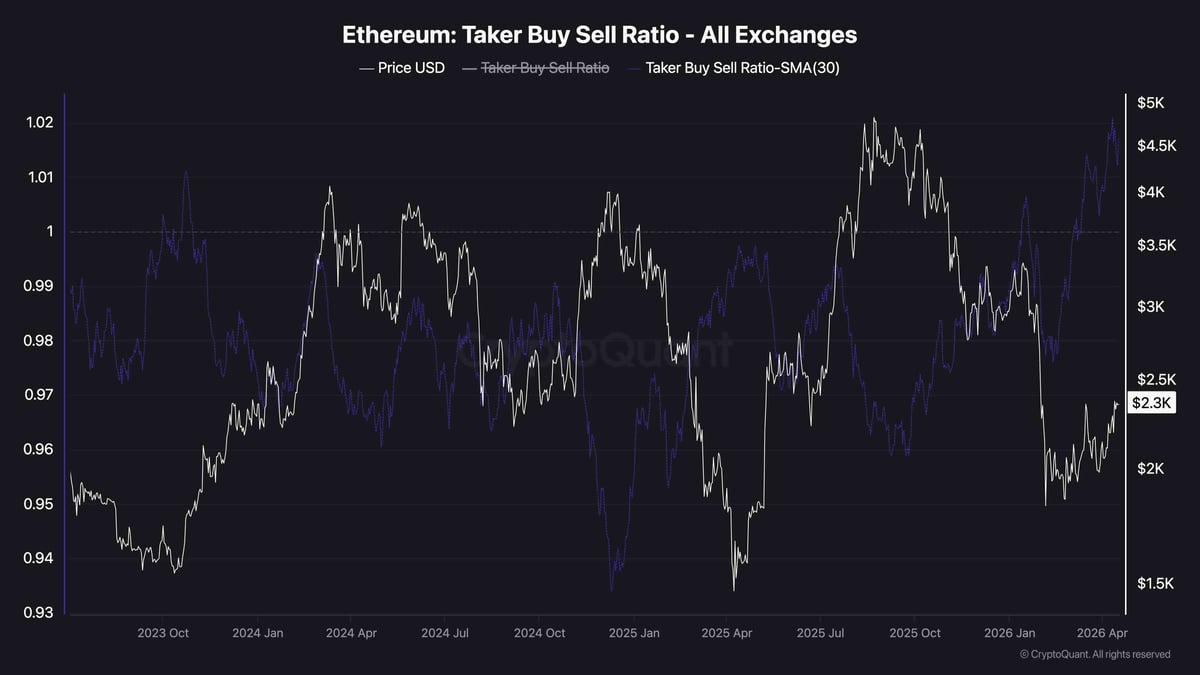
The 30-day moving average of the Ethereum Taker Buy/Sell Ratio has spiked to approximately 1.02, which is the highest reading in the entire dataset stretching back to mid-2023. This metric has been showing values below 1 for the majority of the past 3 years, and current readings indicate that aggressive market buyers are now significantly outpacing sellers in the futures market. The timing of this surge, coinciding with $ETH’s push toward the $2.3k–$2.4k resistance zone, suggests the recent price action is being driven by genuine futures market demand rather than a passive drift higher.
Historically, rising taker buy/sell ratios have accompanied the early stages of meaningful price advances, as seen at the beginning of previous price rallies. The current reading is particularly notable because it finally represents a clear shift in futures market behavior.
That said, a ratio this elevated can also precede short-term exhaustion if the price fails to follow through above key resistance, which makes the $2.4k level the immediate litmus test for whether the current demand surge translates into a sustained trend change or simply another episode of aggressive buying turning into a long liquidation cascade shortly afterward.