


 9
9
Ethereum price action has entered a decisive phase as bulls attempt to reclaim control after months of pressure. The daily chart shows a market shifting from a prolonged downtrend into a fragile recovery.
However, momentum remains mixed across timeframes. Short-term strength has emerged, yet higher timeframe resistance continues to cap upside attempts. Consequently, traders now focus on a tight range where the next breakout could define Ethereum’s direction for weeks.
Market Structure Signals Cautious Recovery
Ethereum still trades within a broader bearish structure defined by lower highs and lower lows. However, the sharp decline into February created a clear capitulation zone. Buyers stepped in aggressively, forming a base that now supports the current rebound.
Moreover, price has started reclaiming short-term moving averages, signaling improving momentum. Despite this, Ethereum remains below major long-term averages. Hence, the macro trend has not fully shifted bullish.
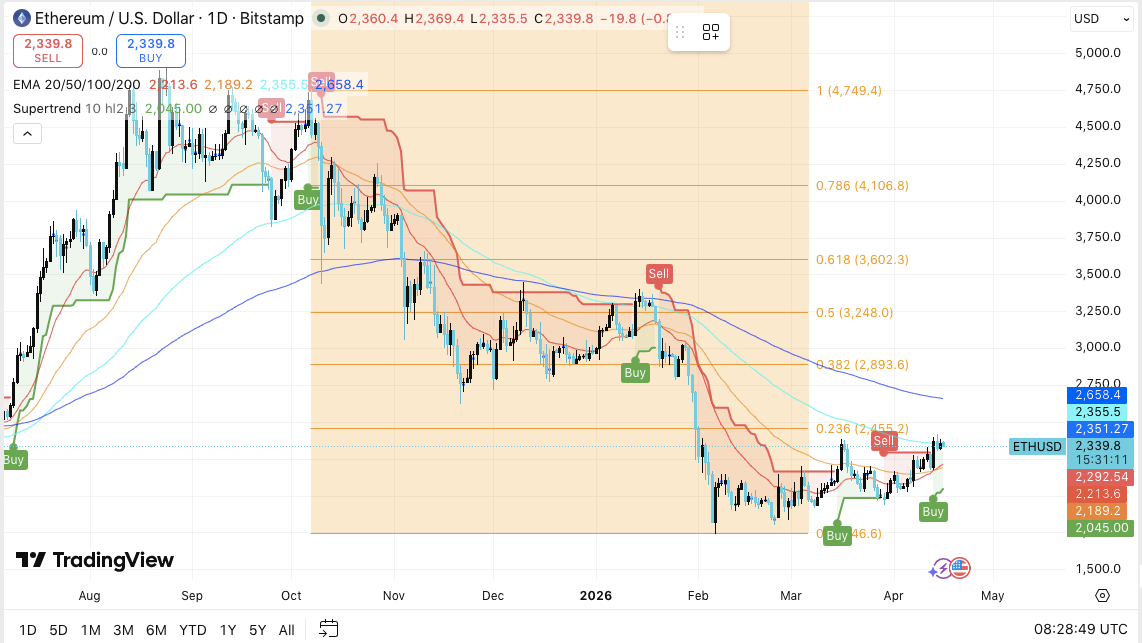
Additionally, Fibonacci retracement levels highlight the current weakness in the rally. Price struggles below the 0.236 level near $2,455. This area acts as immediate resistance and continues to reject upward movement.
Key Levels Define the Next Move
Resistance remains clearly stacked above current price levels. The $2,450–$2,500 zone serves as the first major barrier. A confirmed break above this region could open the path toward $2,893. This level represents a critical breakout point.
Furthermore, a move toward $3,248 would strengthen the case for a full trend reversal. Beyond that, the $3,600 region stands as a major supply zone where sellers may return.
Related: Bio Protocol ($BIO) Price Prediction: $BIO Surges 123%—New Bull Cycle Ahead?
On the downside, support remains firm between $2,150 and $2,200. This zone currently holds the short-term structure together. However, a breakdown below $2,100 could trigger a deeper pullback toward the $1,800 range.
Derivatives and Flows Show Market Reset
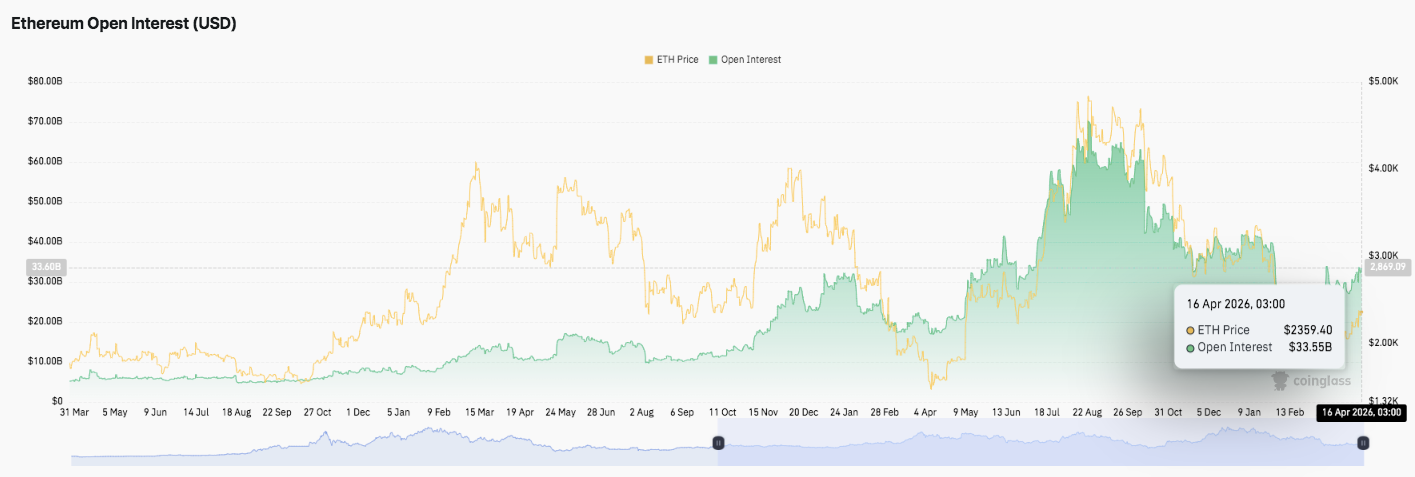
Open interest data reveals a cooling phase after previous excessive leverage. Earlier peaks above $60 billion reflected crowded positioning and increased risk.
Subsequently, the drop toward $30–$35 billion suggests a healthier reset. Besides, this decline indicates that speculative pressure has eased. This creates room for more sustainable growth if demand returns.
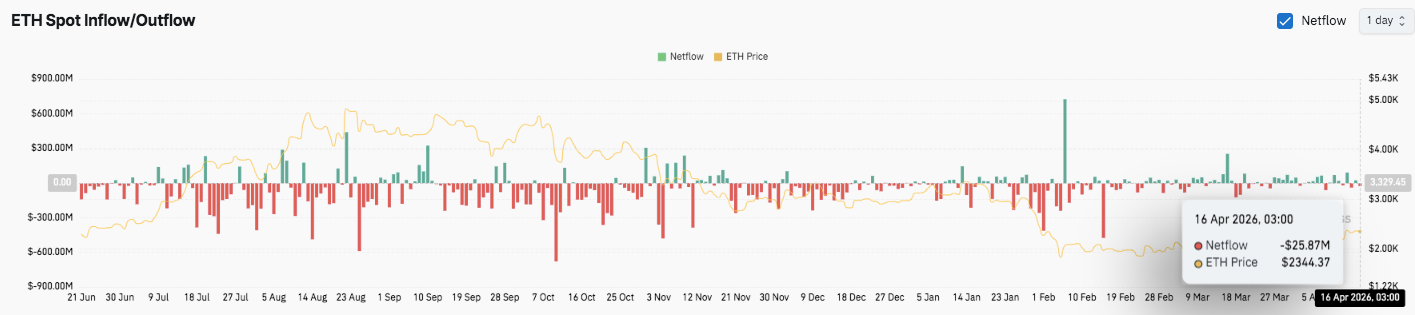
Spot flow data supports this cautious optimism. Prolonged outflows previously signaled strong selling pressure. However, recent flows show a shift toward balance, with slight inflow bias emerging.
Moreover, opportunistic buying near recent lows hints at early accumulation. This behavior often precedes stronger recovery phases if consistency follows.
Related: Bitcoin Price Prediction: $597M In Two-Day ETF Inflows Cannot Move BTC Past $75,266
Technical Outlook for Ethereum (ETH) Price
Key levels remain clearly defined as Ethereum consolidates within a tightening range.
Upside levels: $2,450–$2,500 stands as the immediate resistance zone. A breakout above this region could open the path toward $2,893. Further strength may extend gains to $3,248, with $3,600 acting as a major macro ceiling.
Downside levels: $2,200 serves as initial support for the current structure. Below that, $2,100 becomes critical for maintaining bullish momentum. A breakdown could expose $1,850 and potentially the $1,750 accumulation base.
Resistance ceiling: The $2,450 zone, aligned with the 0.236 Fibonacci level, remains the key barrier to flip for sustained upside continuation.
The technical structure shows Ethereum compressing after a relief rally within a broader downtrend. This range-bound movement suggests volatility expansion may follow once price escapes the current consolidation zone.
Will Ethereum Move Higher?
Ethereum’s short-term outlook depends on whether buyers can defend the $2,200 level while building momentum toward $2,500. A confirmed breakout above resistance would likely attract fresh demand and push price toward higher Fibonacci levels.
However, failure to hold support could shift sentiment quickly. Losing $2,100 would weaken the structure and increase the probability of a deeper retracement toward $1,800.
For now, Ethereum trades in a pivotal range where both bulls and bears remain active. Market flows and momentum indicators suggest early accumulation, but confirmation remains necessary. The next decisive move will likely come from a breakout or breakdown of this compression zone.
Related: Chainlink Price Prediction: SIX Exchange Puts €2T In Equities Onchain as LINK Tests $9.153
