


 17
17
Earlier today, the Ethereum price witnessed an intraday gain of 1.9% to reach a high of $2,414. The buying pressure followed the release of US March 2026 PPI data, which recorded a slight uptick 0.5% month-over-month. However, the coin price reverted immediately to $2,345 during Tuesday’s U.S. market as the recent recovery resembles a bear market relief rally pattern rather than a structural trend reversal. Key levels in $ETH’s ongoing recovery attempt.
$ETH Reclaims $2300 as PPI Boosts Rate Cut Bets
Since last week, the Ethereum price surged from $2,178 to $2,343, registering a gain of 7.56%. A primary catalyst to this surge can be linked diplomatic discussions between the U.S. and Iran which raised hopes of a de-escalation in the conflict and the reopening of the Strait of Hormuz.
The buying pressure persisted before the U.S. opening bell as investors cheered news of lower-than-anticipated March 2026 Producer Price Index (PPI) data. The index increased only 0.5% month-over-month and 4.0% year-over-year, comfortably less than the forecasts of economists of 1.1% and 4.6%.
The lower wholesale inflation index reinforces the argument of Federal Reserve rate cuts in later 2026. The data alleviates fears of ongoing inflation and forecasts that the monetary policy will be increasingly accommodative, as it indicates that price pressures on the producer level are decelerating at a rate slower than expected initially.
Wall Street is currently putting higher probabilities on easing of the policy and the attention is moving to the next set of CPI, and Fed indications to understand more.
As a result, Ethereum price returned to the $2,300 level, regaining the average buying price of those who purchased between one and three months ago, as crypto prices overall picked up.
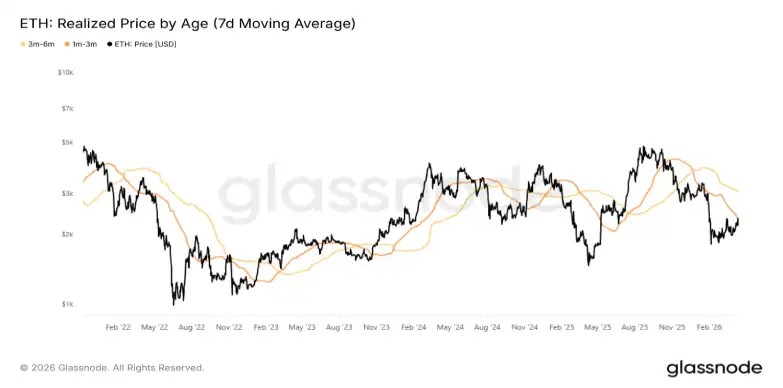
However, the analytics platform, Glassnode, claims that this recovery resembles the temporary bounces that were observed in the third and fourth quarters of 2022 when the bear market was at its lowest point. The above on-chain data emphasizes that the recent price movement corresponds to the trend of the short-term relief rallies, as opposed to the onset of a persistent trend reversal.
Ethereum Price Eyes Major Breakout From 70-days Accumulation
On April 10th, the Ethereum price gave a bullish breakout from a six-month long resistance trendline, signaling a major change in market sentiment. After a brief pullback to validate the suitability of this breakout, the $ETH coin bounced 8% on Monday to challenge the overhead resistance trendline at $2,384.
A potential breakout from this resistance will conclude a 10 weeks accumulation zone for the top altcoin, further reinforcing the recovery momentum for $ETH. A sharp spike in Average directional index (ADX) to 17% also accentuated the renewing bullish momentum among buyers.
The post–breakout rally could push the asset $2,630, followed by a leap to $3,000.
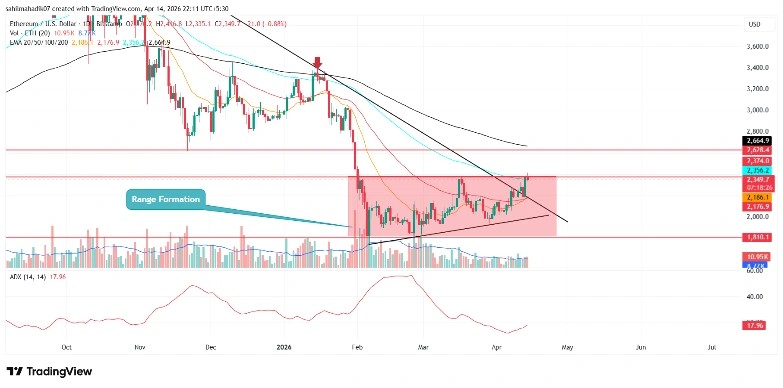
Alternatively, if the sellers continued to define $2,384 resistance, the Ethereum price will prolong its ongoing consolidation.


