


 5
5
Ethereum is trading below $2.2k as the second week of Q2 gets underway. The asset is caught between a slowly improving short-term structure and a daily chart that remains firmly in bearish territory. $ETH has managed to hold above the critical $1.8k support zone since the February lows, but the recovery has been choppy and unconvincing.
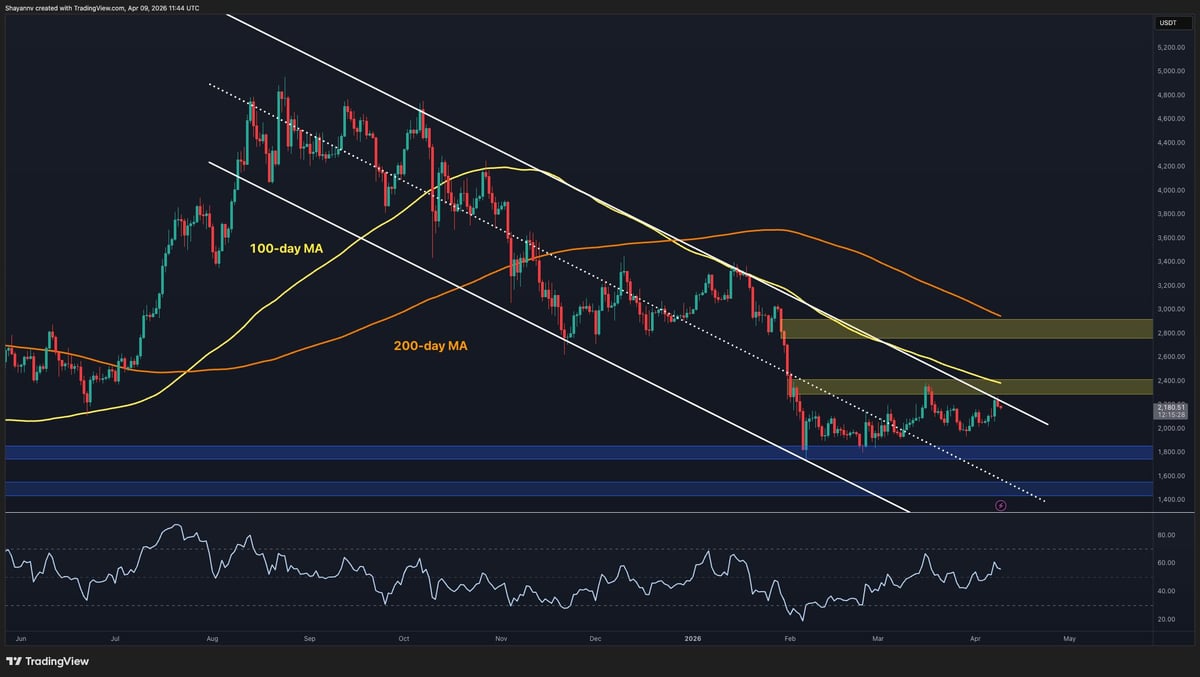
Ethereum Price Analysis: The Daily Chart
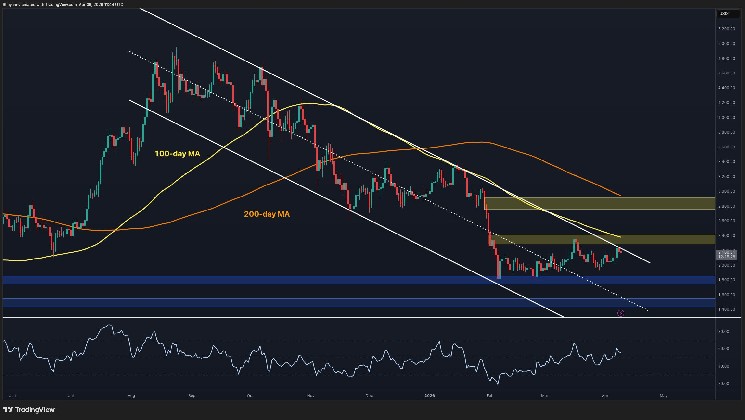
The macro picture on the daily chart has not materially changed over the past couple of weeks. $ETH continues to trade inside a well-defined descending channel, with the 100-day MA (~$2.4k) and 200-day MA (~$2.9k) both declining overhead and forming a compressing resistance ceiling. The $2.4k zone in particular has acted as a hard cap on recovery attempts since February.
Current price sits just above the $2.15k short-term resistance-turned-support area. This level has served as a pivot zone over the past several weeks. Still, the $1.8k support band remains the most important level on the chart.
A breakdown below it on a daily close basis would expose $ETH to $1.6k and $1.4k. Yet, with the price now testing the higher boundary of the descending channel, a successful breakout can lead to a rise above the $2.4k level and the 100-day moving average, which is what buyers would hope to see in the upcoming days.
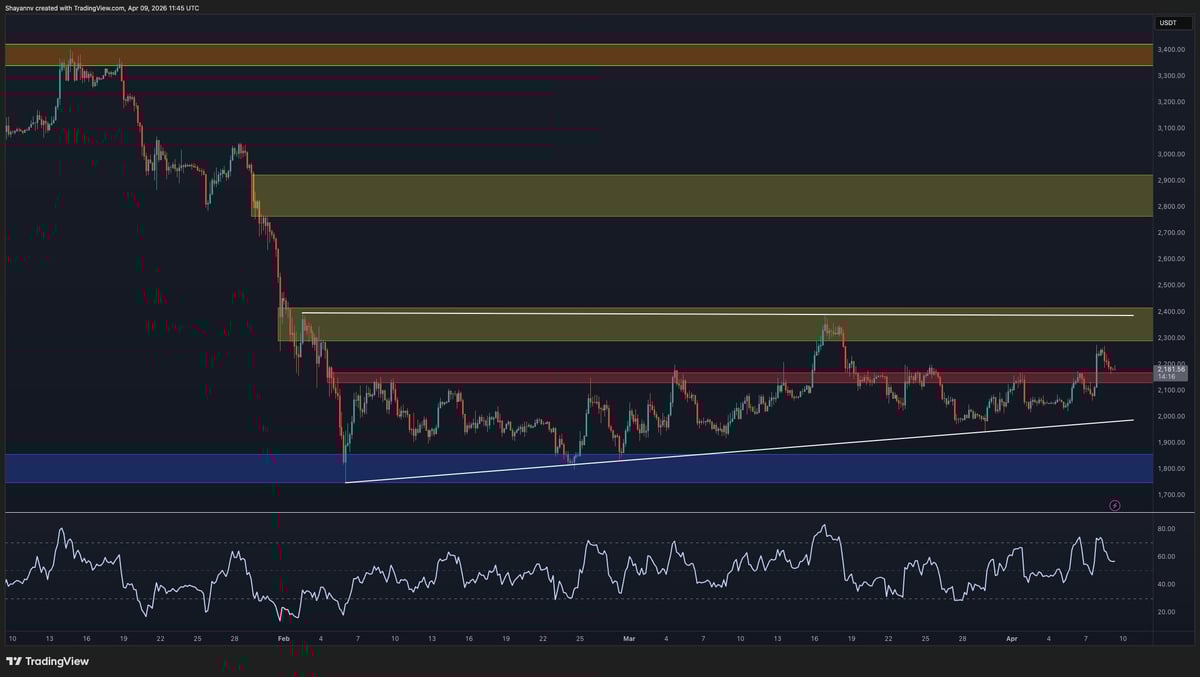
$ETH/USDT 4-Hour Chart
On the 4-hour chart, $ETH’s consolidation in the broad range between roughly $2k and $2.4k since early February is evident. The ascending trendline from the lows has been providing some short-term support. Moreover, the price has recently pushed back toward the upper end of the range, currently retesting the $2.15k area with the RSI above 50. This suggests near-term bullish momentum is building.
The key resistance to watch on this timeframe sits at $2.3k–$2.4k. This is the zone that has capped every meaningful rally attempt in recent weeks. A clean breakout and close above $2.4k would be the most constructive development $ETH has seen in months and could open a run toward $2.8k. To the downside, the ascending trendline and the $1.8k support zone are the levels that need to hold for the short-term structure to remain intact.
Sentiment Analysis
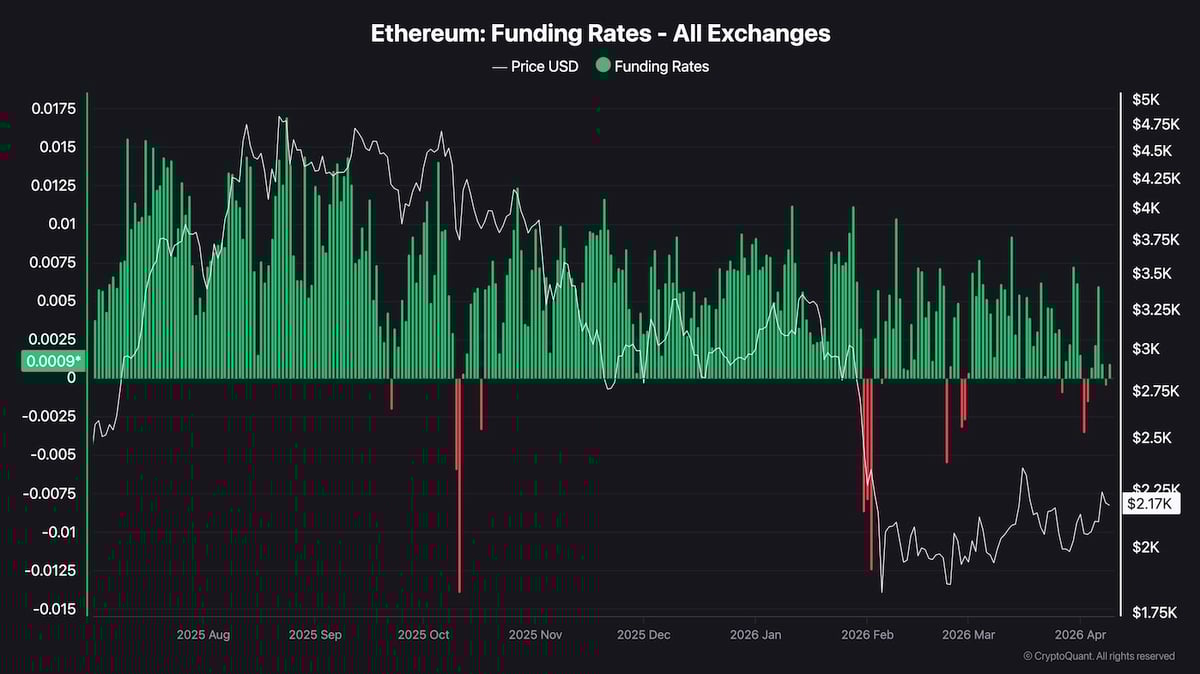
After months of consistently positive funding rates throughout the 2025 bull market, the picture has become notably less stable since the February breakdown. While the most extreme negative readings from the capitulation period have faded, recent readings have been smaller and increasingly inconsistent. There are still brief dips back into negative territory.
This loss of conviction in funding is worth monitoring. It suggests that while the panic-driven short positioning from early February has cleared, the market has not transitioned into the kind of sustained bullish bias that characterized $ETH’s rally toward $5k.
Positive funding is technically still the dominant reading, but the shrinking magnitude and intermittent red bars point to a derivatives market that remains uncertain rather than directionally committed, which aligns with the choppy, range-bound price action seen on the charts.