

 5
5
Ethereum continues to trade within a broad recovery phase after a steep decline from above $3,400. The asset recently found strong footing near $1,744, which now serves as a critical structural base.
Since that point, $ETH has moved in a tight range while showing mild upward pressure. However, the broader trend still lacks strong conviction. Price remains below key longer-term moving averages, which signals that full bullish control has not yet returned.
Key Levels Shape the Current Market Structure
Support and resistance zones continue to guide short-term price behavior. The $1,744 level stands as the most important support. A break below this zone could reopen downside momentum and weaken the recovery structure.
Additionally, the $2,000 psychological level offers a secondary support area. Buyers often defend round numbers, which adds to its importance. The 20 EMA near $2,085 also acts as dynamic support during short pullbacks.
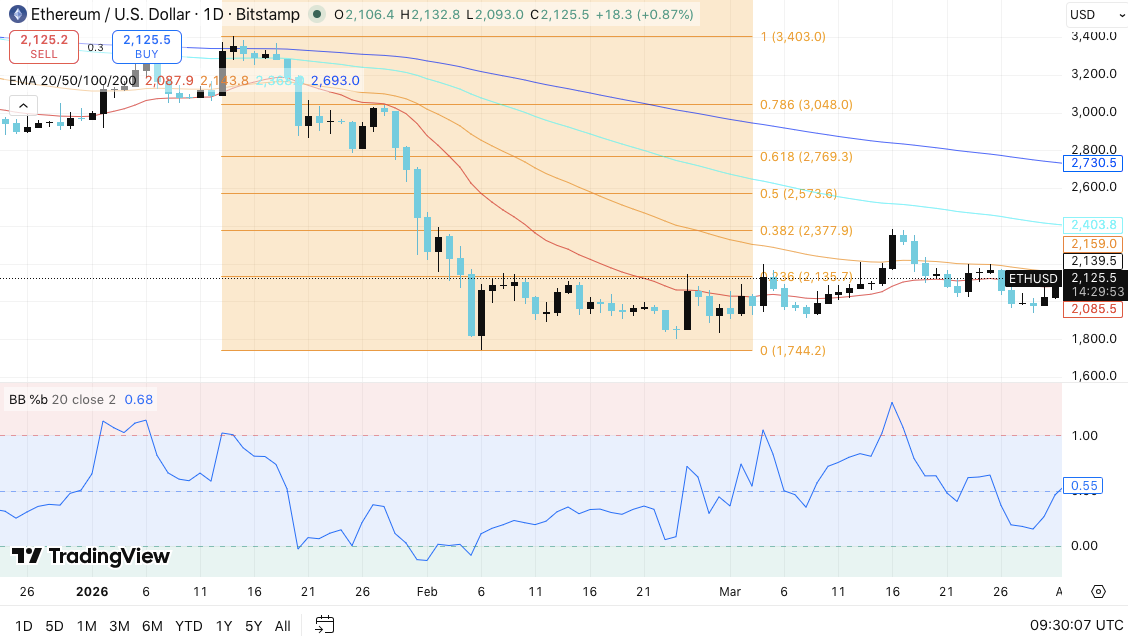
On the upside, resistance builds near $2,159. Price has struggled to break above this level multiple times. Beyond that, the $2,377 and $2,573 Fibonacci levels mark stronger barriers. These zones often act as turning points in retracement trends.
Related: Chainlink Price Prediction: Will LINK Break $10 or Fall to $7?
Furthermore, the $2,769 region aligns with the 0.618 Fibonacci level. A move above this area would signal a stronger trend shift. Longer-term EMAs at $2,400 and $2,730 also add resistance pressure.
Market Signals Show Mixed Momentum
Indicators point to a market in transition rather than a clear trend. The 20 EMA has alternated between support and resistance, which confirms consolidation. Meanwhile, the 50 EMA sits close to price and reflects short-term indecision.
However, the 100 and 200 EMAs remain well above current price. Hence, the long-term structure still leans bearish. This creates a setup where Ethereum builds strength within a larger corrective phase.
The Bollinger %b indicator also reflects balanced momentum. A reading near 0.6 suggests neither overbought nor oversold conditions. Consequently, the market may continue to consolidate before a stronger move develops.
On-Chain and Institutional Activity Add Context
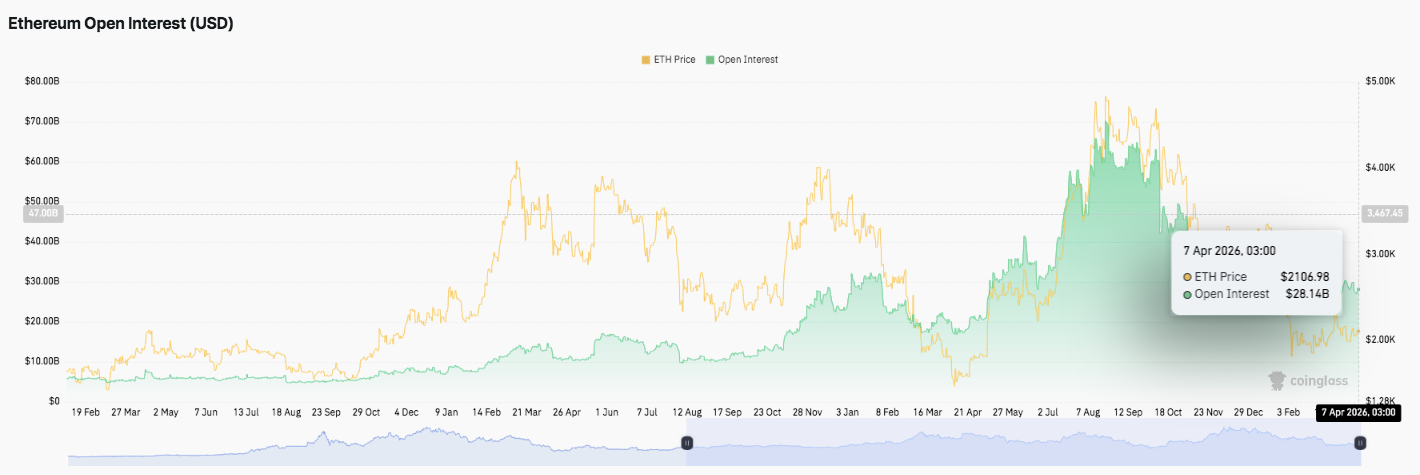
Open interest data shows rising participation in Ethereum markets. Futures engagement reached about $28.14 billion, indicating growing trader activity. This rise aligns with price fluctuations and increased volatility.
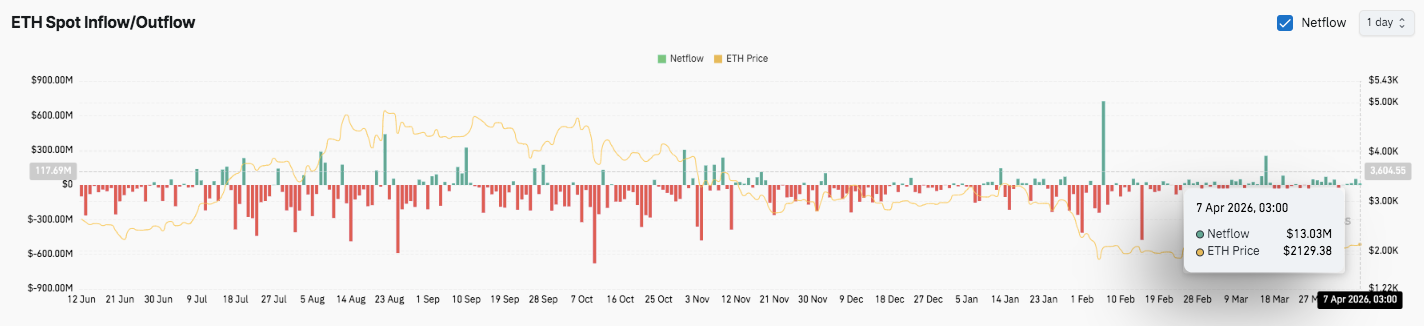
Additionally, spot flow data shows mixed but slightly positive net inflows. Recent figures around $13 million highlight ongoing interest from buyers. However, sharp inflow and outflow spikes suggest uncertainty among market participants.
Related: RedStone Price Prediction: RED Jumps 118% as Bulls Target $0.276
Institutional involvement also strengthens Ethereum’s narrative. BitMine has accumulated over $10 billion in $ETH holdings, which signals strong long-term conviction. Moreover, the firm’s upcoming NYSE uplisting highlights growing confidence in Ethereum’s role within corporate portfolios.
Technical Outlook for Ethereum ($ETH) Price
Key levels remain well-defined as Ethereum trades near a critical decision zone.
Upward levels: $2,159, $2,377, and $2,573 act as immediate resistance hurdles. A breakout above this cluster could extend gains toward $2,769 and $3,048.
Downward levels: $2,085 forms short-term support, followed by $2,000 as a psychological floor. A deeper breakdown exposes $1,744, which represents the major structural low.
Resistance ceiling: The 100-day and 200-day EMAs, located above current price, remain key barriers for medium-term bullish momentum. Ethereum must reclaim these levels to confirm a trend reversal.
The technical structure shows $ETH consolidating after a prior downtrend. Price action now forms a tightening range between support and resistance. Hence, this compression often precedes a volatility expansion in either direction.
Will Ethereum Go Up?
Ethereum’s near-term direction depends on whether buyers defend the $2,085–$2,000 support zone. Holding this area gives bulls a foundation to challenge the $2,159 resistance level. Additionally, sustained strength above this level could trigger a move toward higher Fibonacci zones.
Moreover, stronger inflows and rising open interest suggest growing market participation. Consequently, momentum could build if buyers maintain control and push above $2,377. This would open the path toward $2,573 and beyond.
Related: Solana Price Prediction: Can SOL Hold Steady After Circle Pours $3.25B Into The Network?
However, failure to hold $2,000 would weaken the structure. In that case, Ethereum could revisit $1,744 and potentially extend lower. Therefore, sellers would regain control if price breaks below key supports with volume.