

 4
4
Ethereum’s recovery attempt is losing momentum again. The price is slipping back after failing to sustain strength near the key $2.4k resistance zone. The broader context remains a market trying to stabilize after a sharp downtrend, but repeated rejections on rallies and growing concerns over the war in the Middle East continue to highlight weak follow-through from buyers.
Ethereum Price Analysis: The Daily Chart
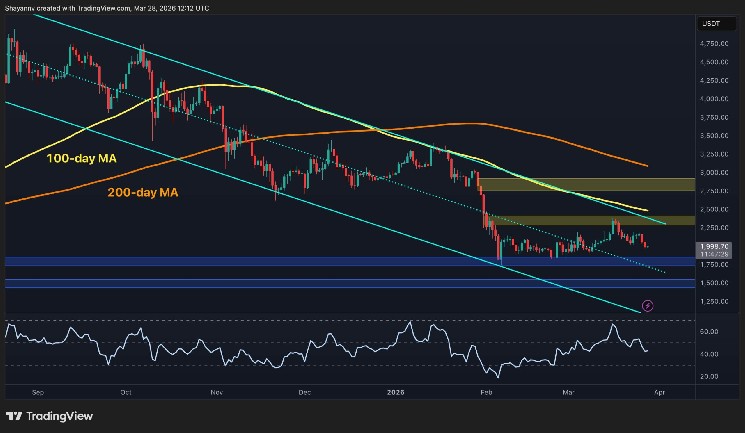
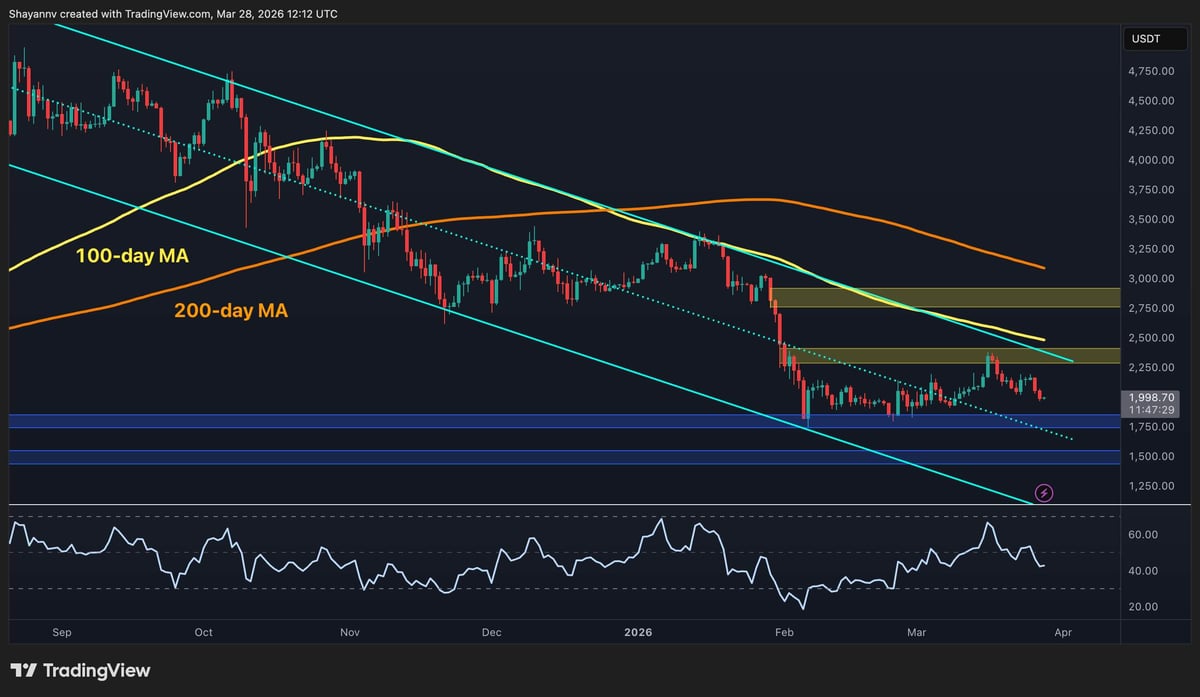
On the daily timeframe, $ETH remains firmly below the 100-day and 200-day moving averages, which are located around the $2.5k and $3.1k levels, respectively. Both moving averages are trending downward and acting as dynamic resistance overhead. The overall structure is also still characterized by lower highs, and the recent bounce has not been strong enough to break out of the descending channel pattern.
The price recently pushed into the $2.4k supply zone but failed to hold, reinforcing this region as a key resistance cluster. This area aligns with a bearish order block and continues to attract selling pressure. Therefore, as long as $ETH trades below it, the broader trend remains tilted to the downside, with the $1.8k support area being the most probable target for the market to visit in the coming days.
$ETH/USDT 4-Hour Chart
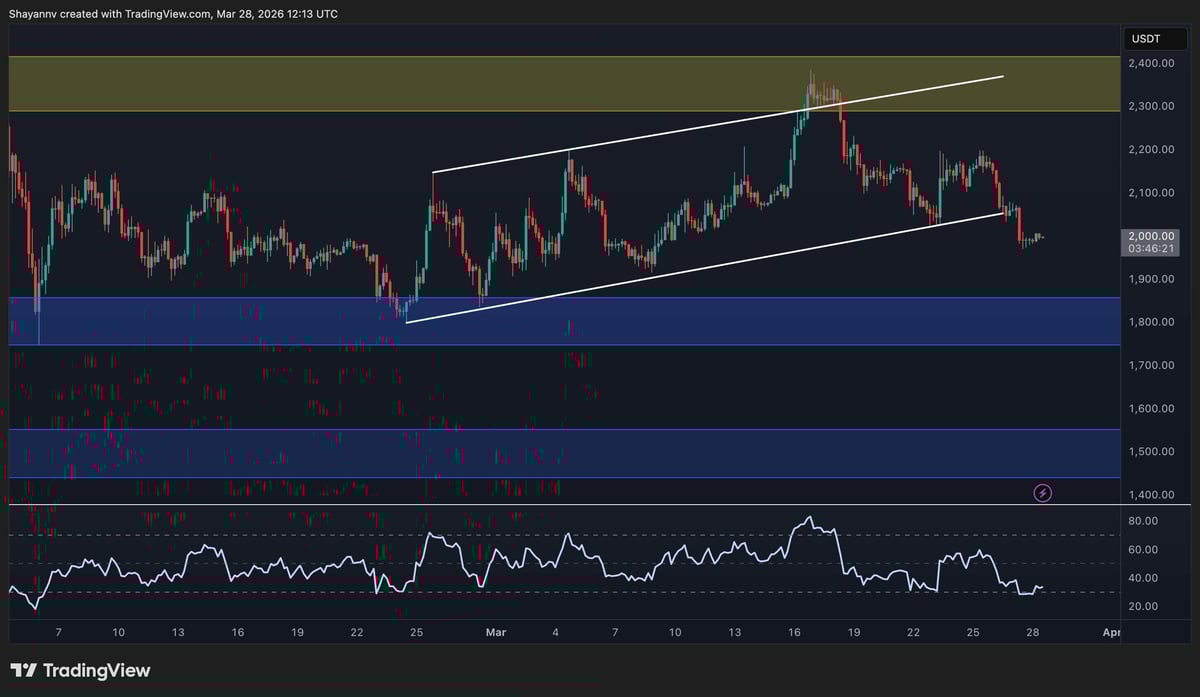
On the 4-hour chart, the short-term recovery structure has clearly weakened. $ETH was previously trading within an ascending channel, but that structure has now broken down. The price has fallen below the channel support and is yet to reclaim it.
The fake breakout and rejection from the upper boundary near $2.4k led to this sharp pullback in the first place, and the asset is now hovering around the $2k level. This area is acting as a short-term pivot, but momentum has cooled significantly, with the RSI dropping back toward neutral levels.
Yet, if $ETH loses $2k with conviction, things would get much worse, as the next logical move would be a retest of the $1.8k demand zone. On the other hand, to regain strength, buyers need to push the price back above the recent high at $2.2k to shift the short-term market structure.
Sentiment Analysis
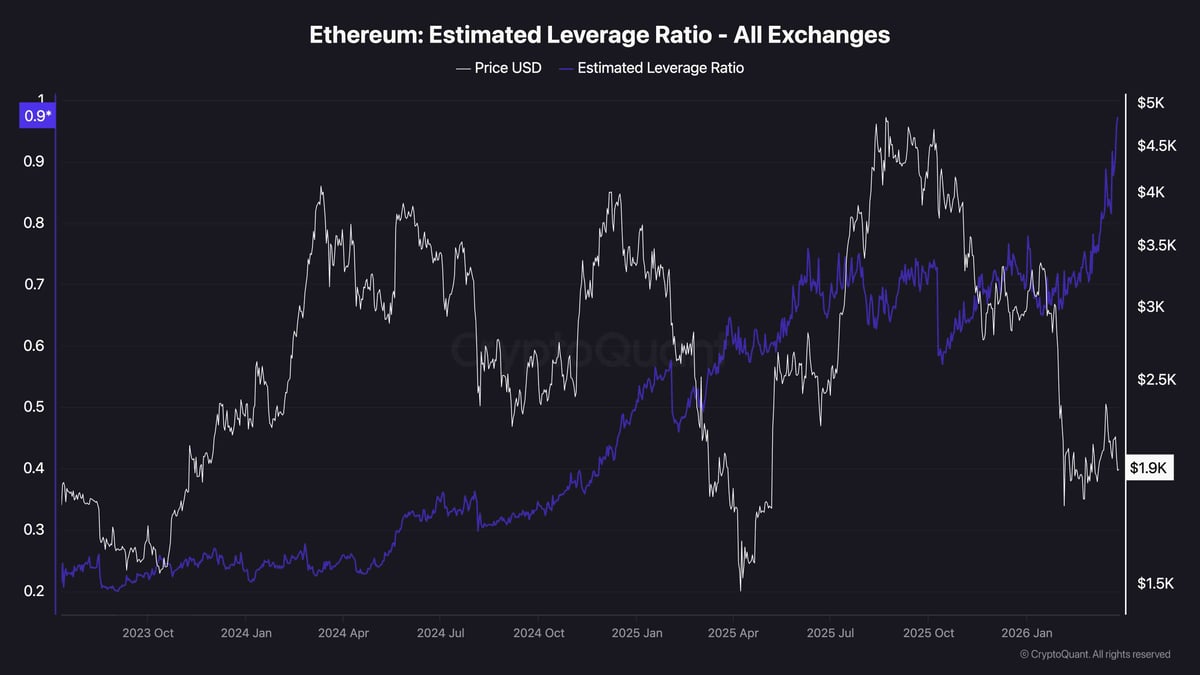
From a sentiment perspective, the Estimated Leverage Ratio is flashing a warning signal. The metric has risen sharply and is now at elevated levels compared to previous periods. This indicates that a significant amount of leverage has built up in the system.
High leverage typically increases the probability of volatility. This is because crowded positioning can lead to cascading liquidations in either direction. In the current context, where price is struggling below resistance, this raises the risk of downside flushes if support levels begin to break.
At the same time, elevated leverage does not automatically imply a bearish outcome, but it does suggest that the market is more fragile. Combined with the lack of strong spot-driven follow-through, sentiment appears unstable, with the potential for sharp moves driven by positioning rather than organic demand.