

 4
4
The bullish Ethereum momentum strengthens as the Supertrend flips green, signaling potential continued upside.
Ethereum ($ETH) is currently trading at approximately $2,323, showing a modest 0.2% change over the last 24 hours. The 24-hour range has hovered between roughly $2,308 and $2,355, with trading volume exceeding $18 billion, reflecting sustained market interest.
The daily chart captures a volatile but ultimately bullish intraday session: $ETH spiked sharply toward the upper range early on before pulling back and consolidating near current levels.
This pattern aligns with Ethereum’s impressive short-term momentum, posting a 15.4% surge over the past week and a 17.9% pump in the last 30 days. Traders will now be watching for a clear recovery phase amid broader crypto market optimism.
Can Ethereum Recover?
Ethereum’s daily chart is displaying a significant bullish development as the price recently broke above the Supertrend indicator. Throughout February and most of March, the descending Supertrend line acted as overhead resistance, steadily declining and capping rallies.
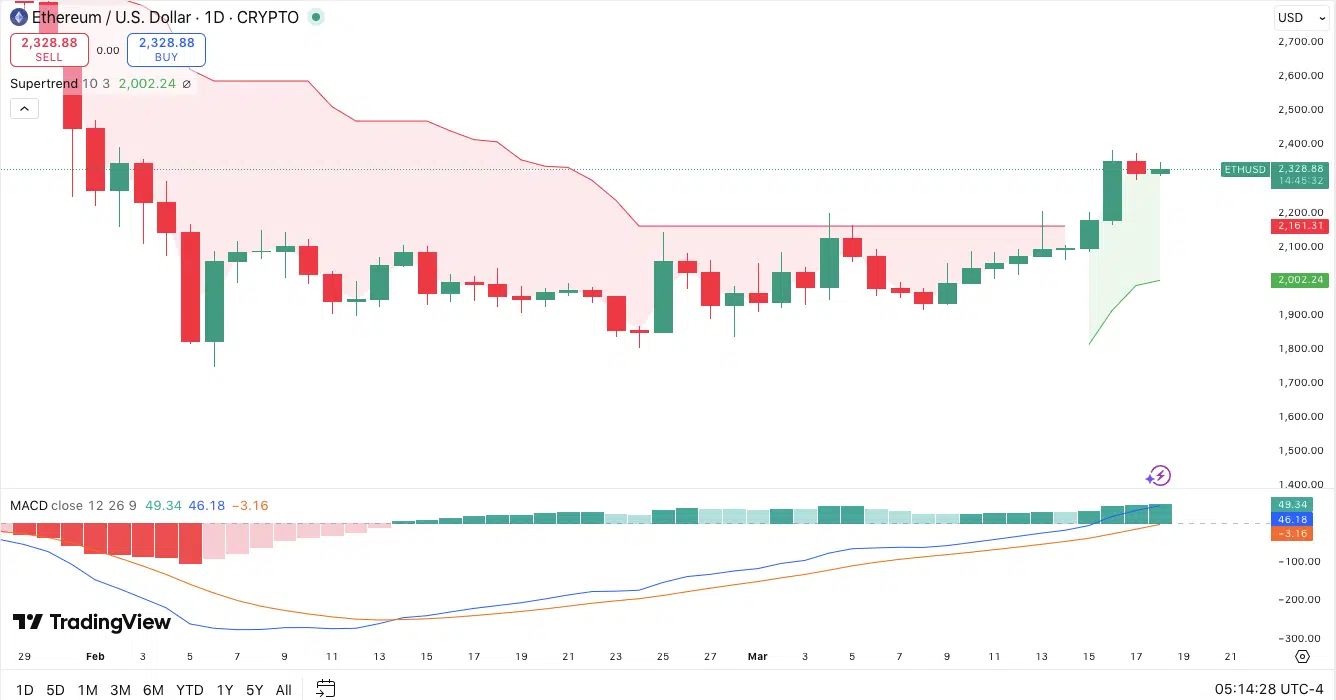
This decisive breakout is technically meaningful, often interpreted as the end of the recent corrective phase and the potential start of a new uptrend. The indicator has now flipped to provide dynamic support well below current levels at approximately $2,002.
Momentum indicators reinforce the positive shift. The MACD recently registered a clear bullish crossover, with the MACD line now above the signal line. Also, both lines are trending higher, and the histogram is expanding positively into green territory.
This alignment of a clean Supertrend breakout and strengthening MACD momentum creates a constructive technical setup. It suggests Ethereum may have the foundation for continued upside in the near term if it holds above the Supertrend support.
Ethereum Liquidation Data
Ethereum’s derivatives market has shown notable liquidation activity over the past 24 hours, with total rekt positions reaching $35.03M.
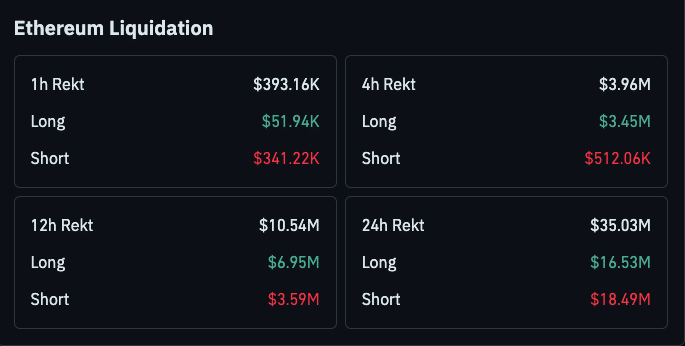
The 24-hour breakdown reveals a balanced but slightly bearish tilt: longs liquidated $16.53 million while shorts saw $18.49M in forced closures. Shorter windows highlight intraday volatility: the 4-hour rekt totaled $3.96M (longs $3.45M, shorts $512K).
Over 12 hours, $10.54M was liquidated ($6.95M longs vs. $3.59M shorts), and the 1-hour figure stood at $393K ($52K longs vs. $341K shorts). This pattern aligns with Ethereum’s recent breakout above key levels, where rising prices triggered short-side pain.