


 8
8
Ethereum tests key psychological resistance zone while buyers continue defending channel support.
Ethereum ($ETH) trades near $1,985, posting a 2.0% gain over the past 24 hours as the market shows signs of a short-term rebound. The intraday chart illustrates several swings throughout the session, with the price trading between $1,922 and $2,009. After dipping toward the lower end of that band during the early hours, Ethereum gradually recovered and pushed higher, briefly testing the $2,000 level before easing slightly.
The chart reveals a sequence of higher intraday pushes that has lifted the asset from the mid-$1,930 region toward the $2,000 mark, signaling improving short-term sentiment. Even so, the price still fluctuates near this psychological level as traders evaluate whether the recent upward movement can develop into a stronger breakout.
Ethereum Price Analysis
Looking at the technical charts, Ethereum trades at just above $1,970 after stabilizing following a sharp decline earlier in the trend.
Recent candles indicate the asset is forming a sideways consolidation range around the $1,900–$2,050 region, suggesting the market is attempting to establish a short-term base following the downtrend over the weekend. Price movement remains relatively tight compared with the earlier sell-off, indicating that volatility has cooled as buyers and sellers compete for control near current levels.
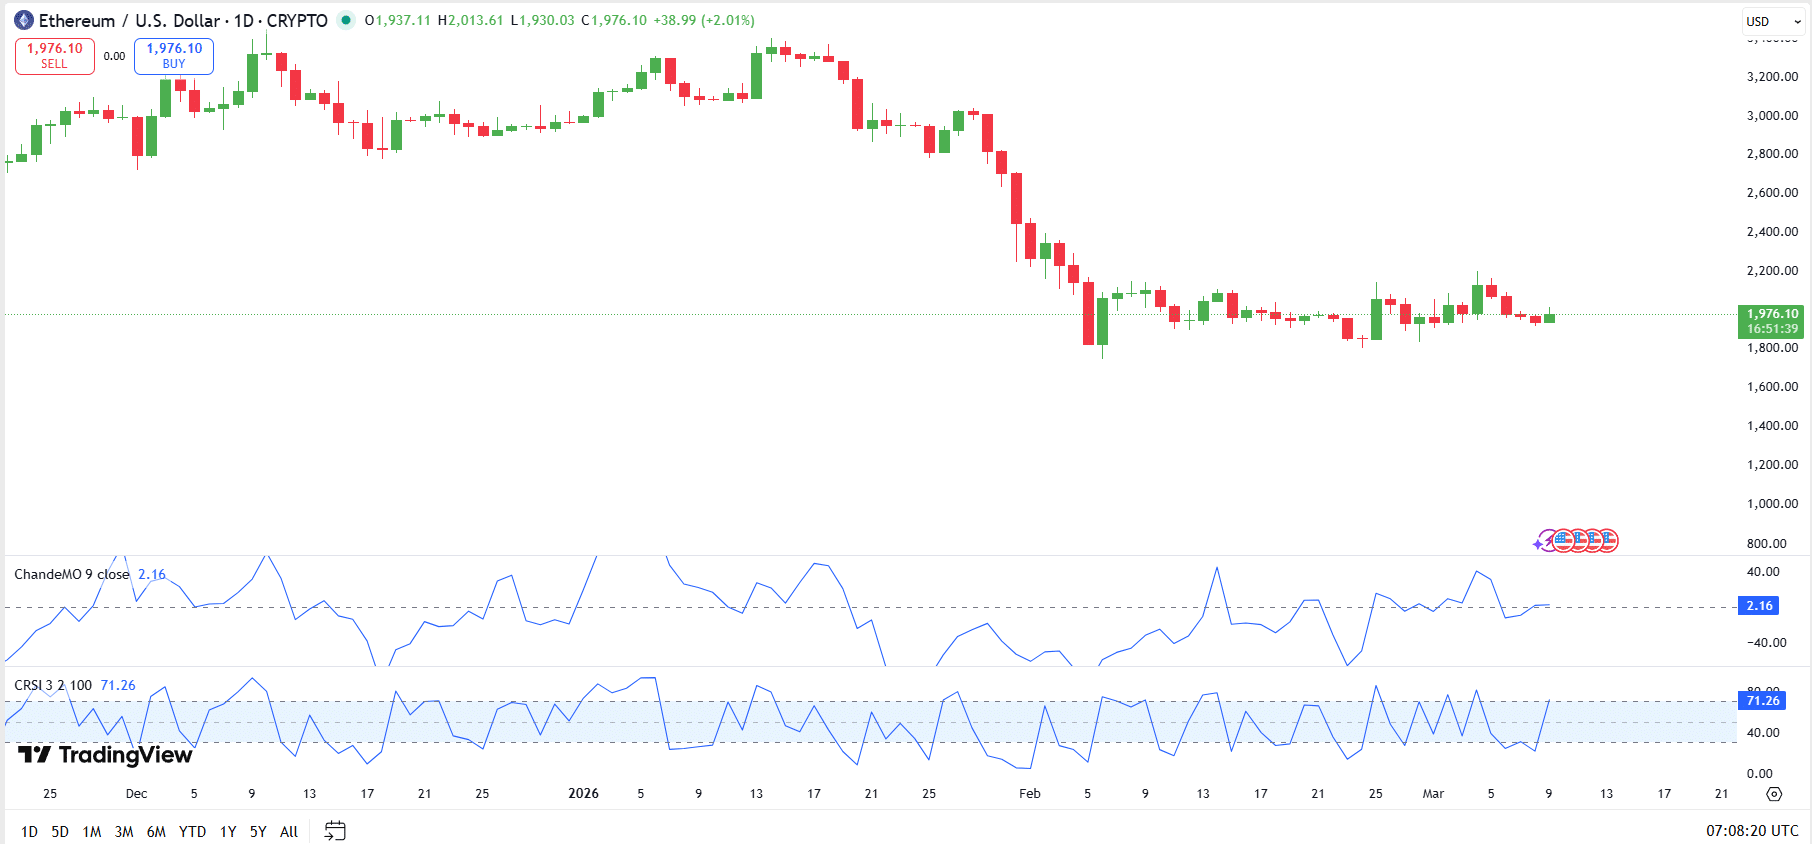
Momentum indicators provide additional insight into the current structure. The Chande Momentum Oscillator sits slightly above the neutral line near 2, signaling that bullish and bearish pressure are nearly balanced in the market. Meanwhile, the Connors RSI indicator has climbed toward 71, approaching the upper range typically associated with stronger buying activity.
This shift suggests that short-term bullish momentum may be building as Ethereum tests the upper edge of its consolidation zone. If the asset maintains this momentum, it could attempt to challenge resistance near the $2,000–$2,100 area, while a loss of strength may keep the market moving sideways in the near term.
Ethereum Support is Getting Defended
Meanwhile, crypto analyst Jonathan Carter highlights that Ethereum is currently rebounding from the lower boundary of an ascending channel on the weekly chart. This structure has guided price movement for an extended period.

According to the analysis, the recent pullback brought $ETH into a key support zone near the bottom of the channel, where buyers have stepped in to defend the level. The rebound suggests the broader channel structure remains intact for now, indicating that the market is attempting to stabilize after the recent decline.
The analyst notes that holding above this support keeps the broader bullish framework in place and creates what he describes as a favorable risk-reward setup for a potential recovery move.
If Ethereum continues to defend the lower trendline and momentum strengthens, the chart outlines several possible upside targets along the channel structure. These include $2,350, $2,800, $3,550, $4,700, and $5,700, which align with previous resistance zones within the trend.